Debug Toolbar
An async-native debug toolbar for Python ASGI frameworks with support for Litestar, Starlette, and FastAPI.
Installation
# With Litestar integration
uv add debug-toolbar[litestar]

# With Starlette integration
uv add debug-toolbar[starlette]

# With FastAPI integration
uv add debug-toolbar[fastapi]

# With Advanced-Alchemy SQLAlchemy panel
uv add debug-toolbar[advanced-alchemy]

# Everything
uv add debug-toolbar[all]
# With Litestar integration
pip install debug-toolbar[litestar]

# With Starlette integration
pip install debug-toolbar[starlette]

# With FastAPI integration
pip install debug-toolbar[fastapi]

# With Advanced-Alchemy SQLAlchemy panel
pip install debug-toolbar[advanced-alchemy]

# Everything
pip install debug-toolbar[all]
# With Litestar integration
pdm add debug-toolbar[litestar]

# With Starlette integration
pdm add debug-toolbar[starlette]

# With FastAPI integration
pdm add debug-toolbar[fastapi]

# With Advanced-Alchemy SQLAlchemy panel
pdm add debug-toolbar[advanced-alchemy]

# Everything
pdm add debug-toolbar[all]
# With Litestar integration
poetry add debug-toolbar[litestar]

# With Starlette integration
poetry add debug-toolbar[starlette]

# With FastAPI integration
poetry add debug-toolbar[fastapi]

# With Advanced-Alchemy SQLAlchemy panel
poetry add debug-toolbar[advanced-alchemy]

# Everything
poetry add debug-toolbar[all]
New to debug-toolbar? Start here for installation and your first integration.
Learn how to configure panels, themes, positioning, and behavior.
Explore the built-in panels: Timer, Request, Response, SQL, Logging, and more.
Build your own debug panels with the extensible panel system.
Let Claude Code analyze your debug data with the MCP server integration.
See how debug-toolbar compares to Django, Flask, and FastAPI debug toolbars.
Quick Start
from litestar import Litestar, get
from debug_toolbar.litestar import DebugToolbarPlugin, LitestarDebugToolbarConfig

@get("/")
async def index() -> dict[str, str]:
    return {"message": "Hello, World!"}

config = LitestarDebugToolbarConfig(enabled=True)
app = Litestar(
    route_handlers=[index],
    plugins=[DebugToolbarPlugin(config)],
)
from fastapi import FastAPI
from fastapi.responses import HTMLResponse
from debug_toolbar.fastapi import setup_debug_toolbar, FastAPIDebugToolbarConfig

app = FastAPI()
config = FastAPIDebugToolbarConfig(enabled=True)
setup_debug_toolbar(app, config)

@app.get("/", response_class=HTMLResponse)
async def index():
    return "<html><body><h1>Hello World</h1></body></html>"
from starlette.applications import Starlette
from starlette.middleware import Middleware
from starlette.responses import HTMLResponse
from starlette.routing import Route
from debug_toolbar.core import DebugToolbar
from debug_toolbar.starlette import (
    DebugToolbarMiddleware,
    StarletteDebugToolbarConfig,
    create_debug_toolbar_routes,
)

async def homepage(request):
    return HTMLResponse("<html><body><h1>Hello World</h1></body></html>")

config = StarletteDebugToolbarConfig(enabled=True)
toolbar = DebugToolbar(config)

app = Starlette(
    routes=[Route("/", homepage), *create_debug_toolbar_routes(toolbar.storage)],
    middleware=[Middleware(DebugToolbarMiddleware, config=config, toolbar=toolbar)],
)
Features
Async-Native: Built from the ground up for async/await patterns
Multi-Framework Support: Litestar, Starlette, and FastAPI integrations
Framework-Agnostic Core: Works with any ASGI framework
FastAPI DI Tracking: Monitor dependency injection resolution and caching
Pluggable Panels: Easy to add, remove, or customize
Dark/Light Themes: Toggle between themes
Flexible Positioning: Left, right, top, or bottom
SQL Analysis: EXPLAIN plans for PostgreSQL, SQLite, MySQL, MariaDB
N+1 Detection: Automatic detection of N+1 query patterns with fix suggestions
Flame Graphs: Interactive profiling visualization in speedscope format
Memory Profiling: Multi-backend support (tracemalloc, memray)
Proactive Alerts: Automatic security, performance, and database issue detection
Lifecycle Events: Track Litestar hooks and exception handlers
MCP Server: AI assistant integration for Claude Code analysis
Screenshots
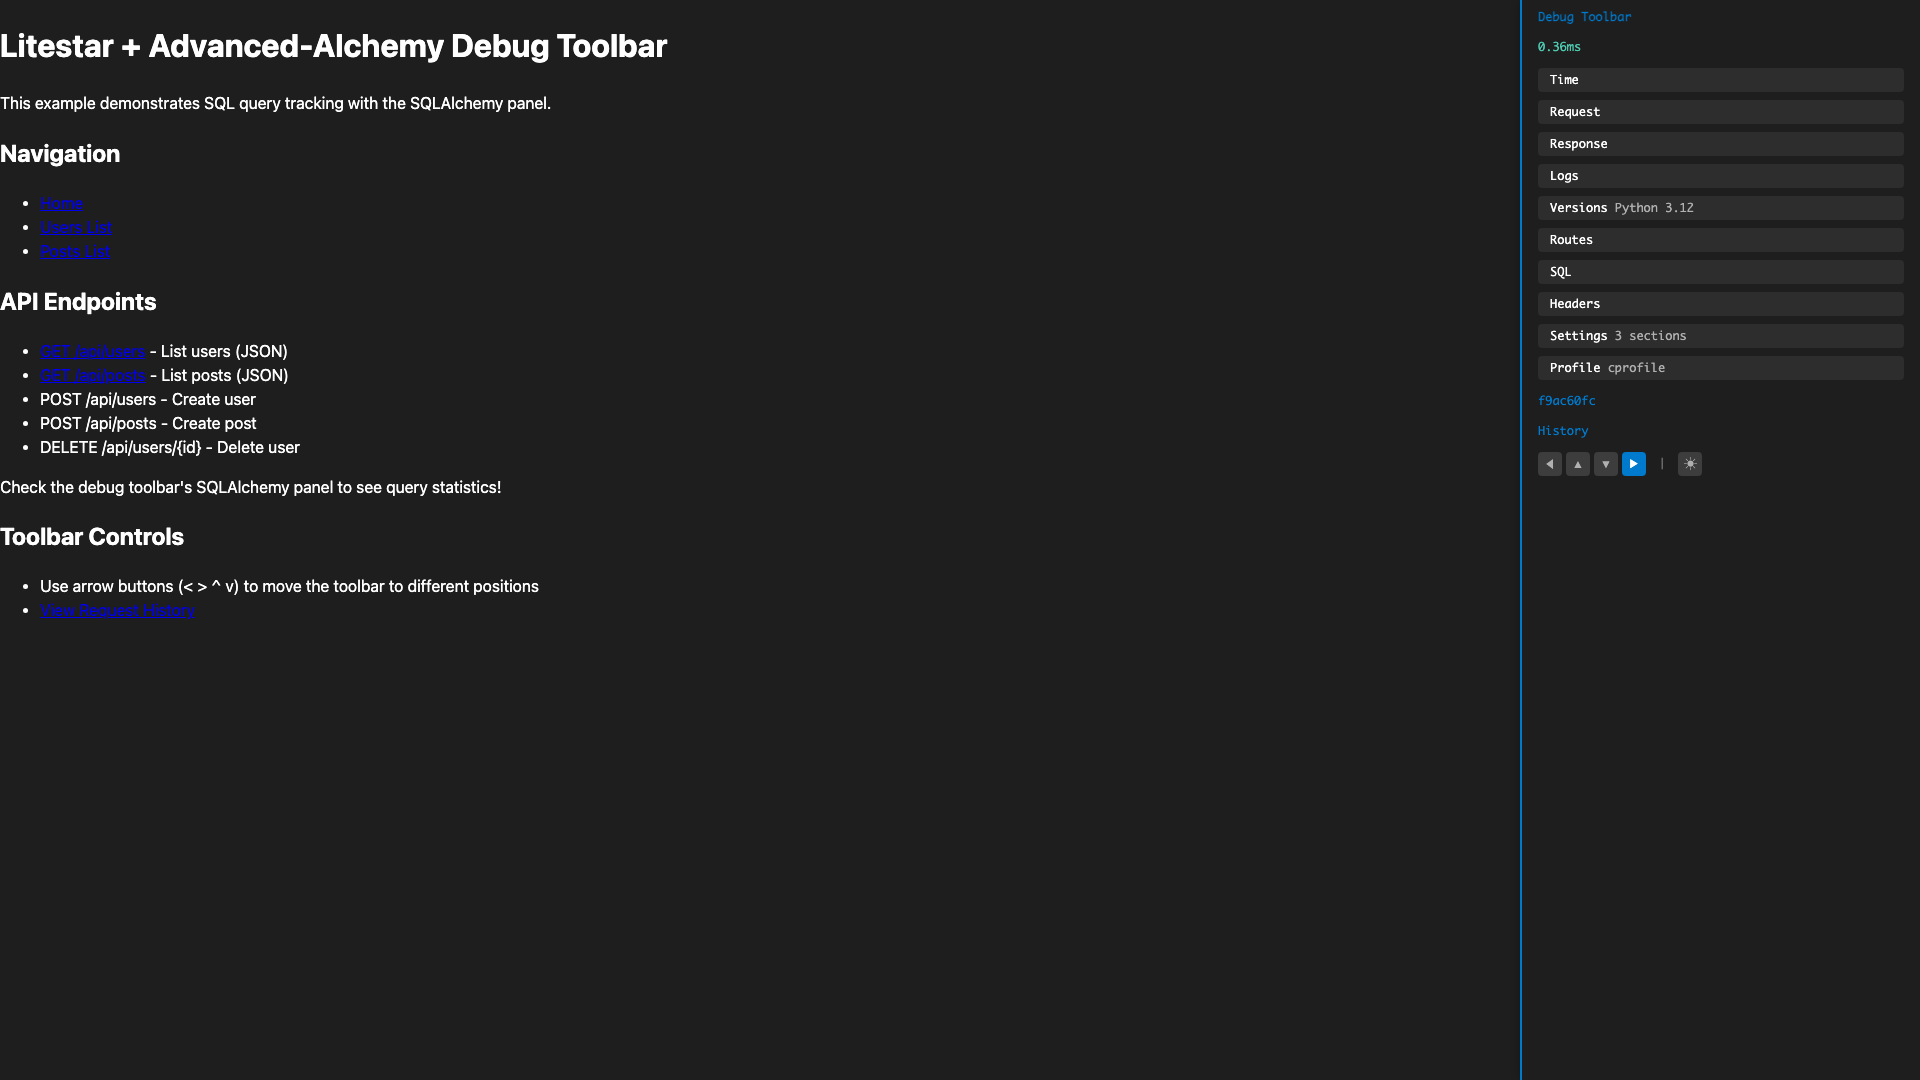
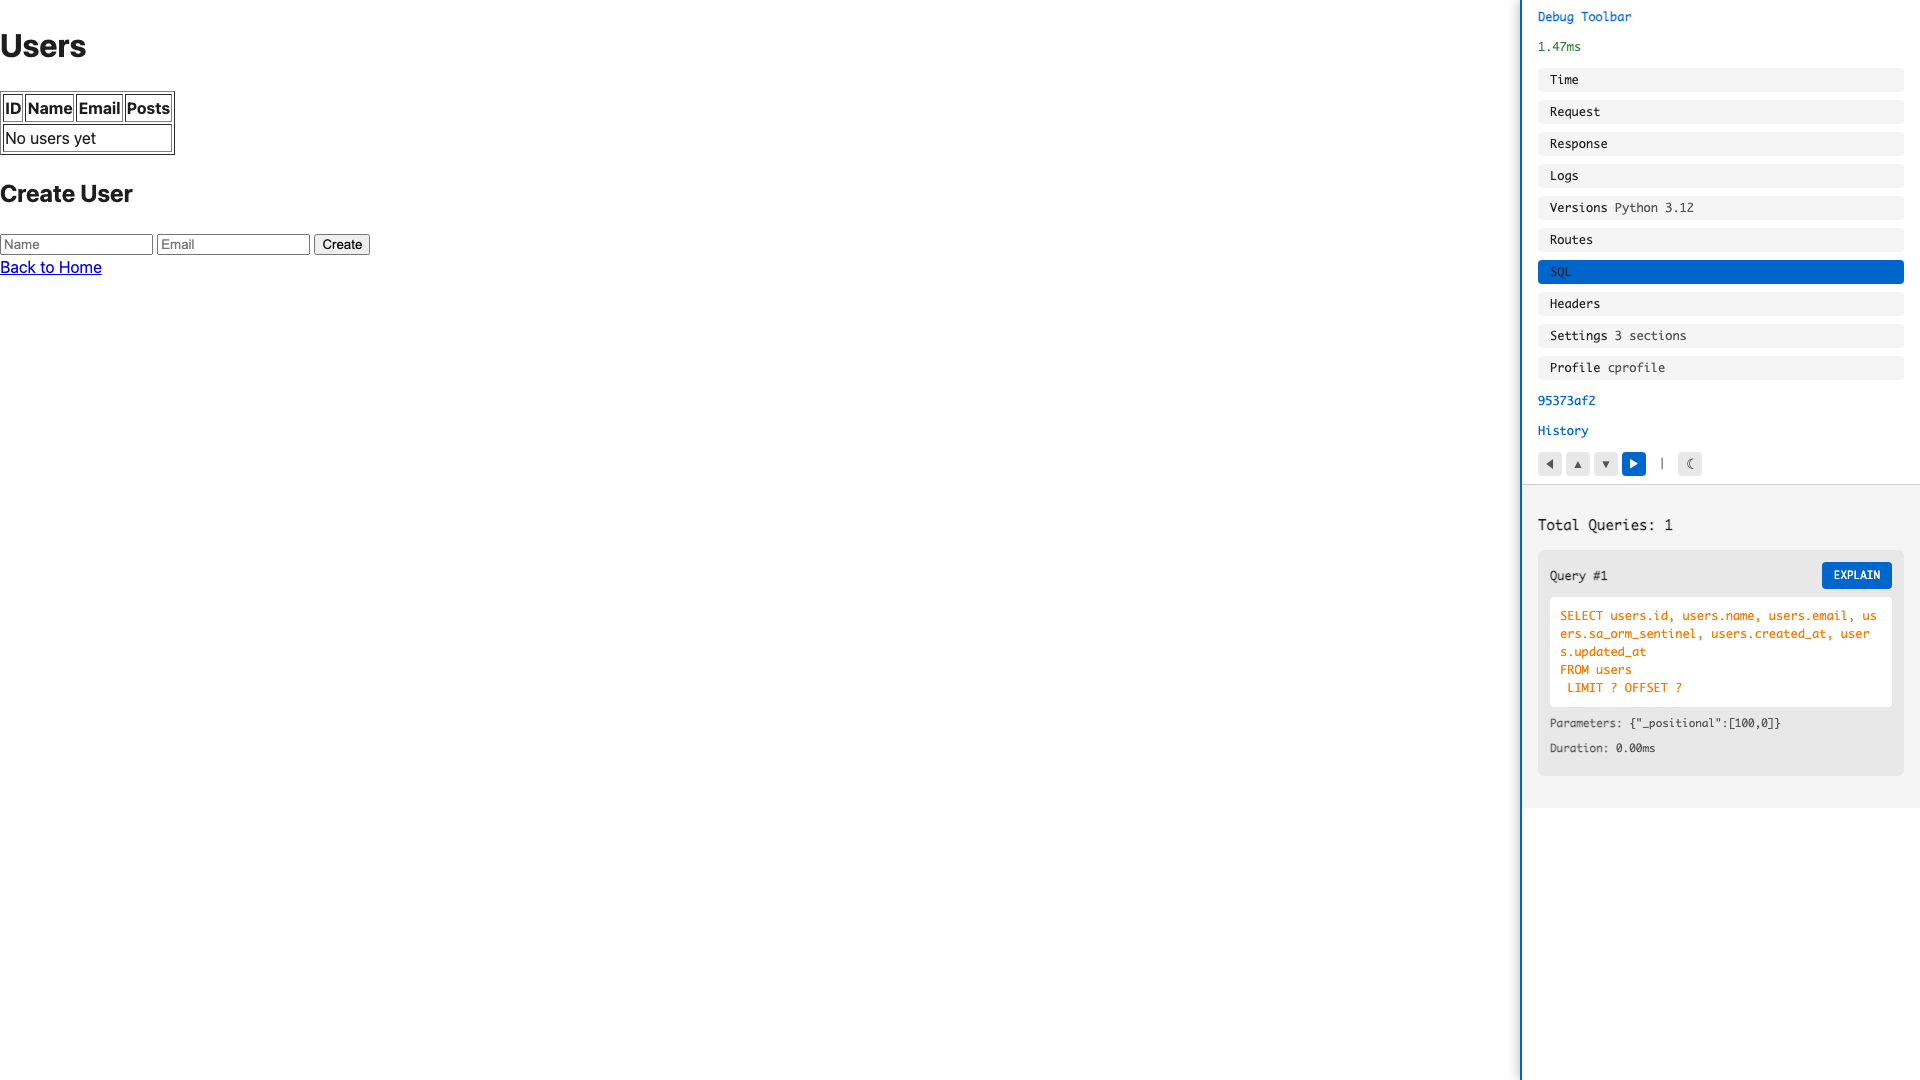
Right-side toolbar with all panels
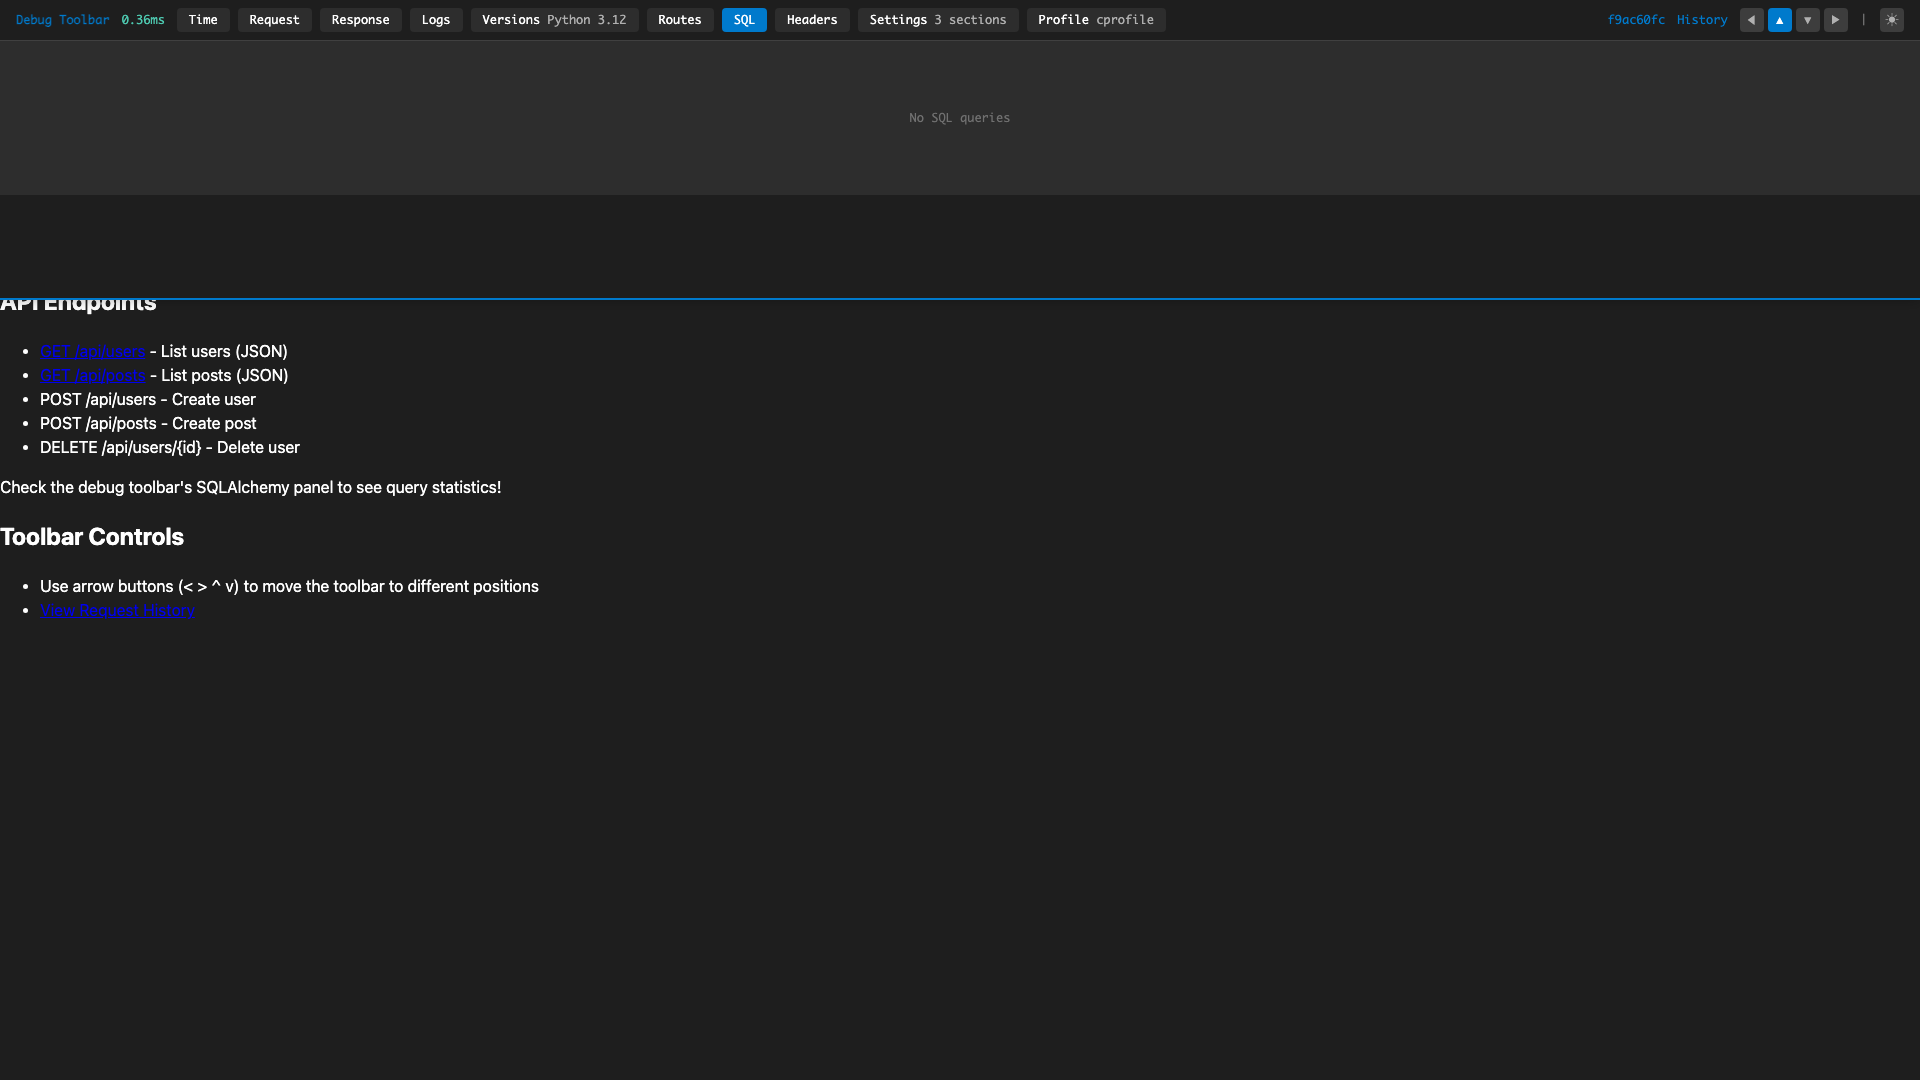
Full-width horizontal layout
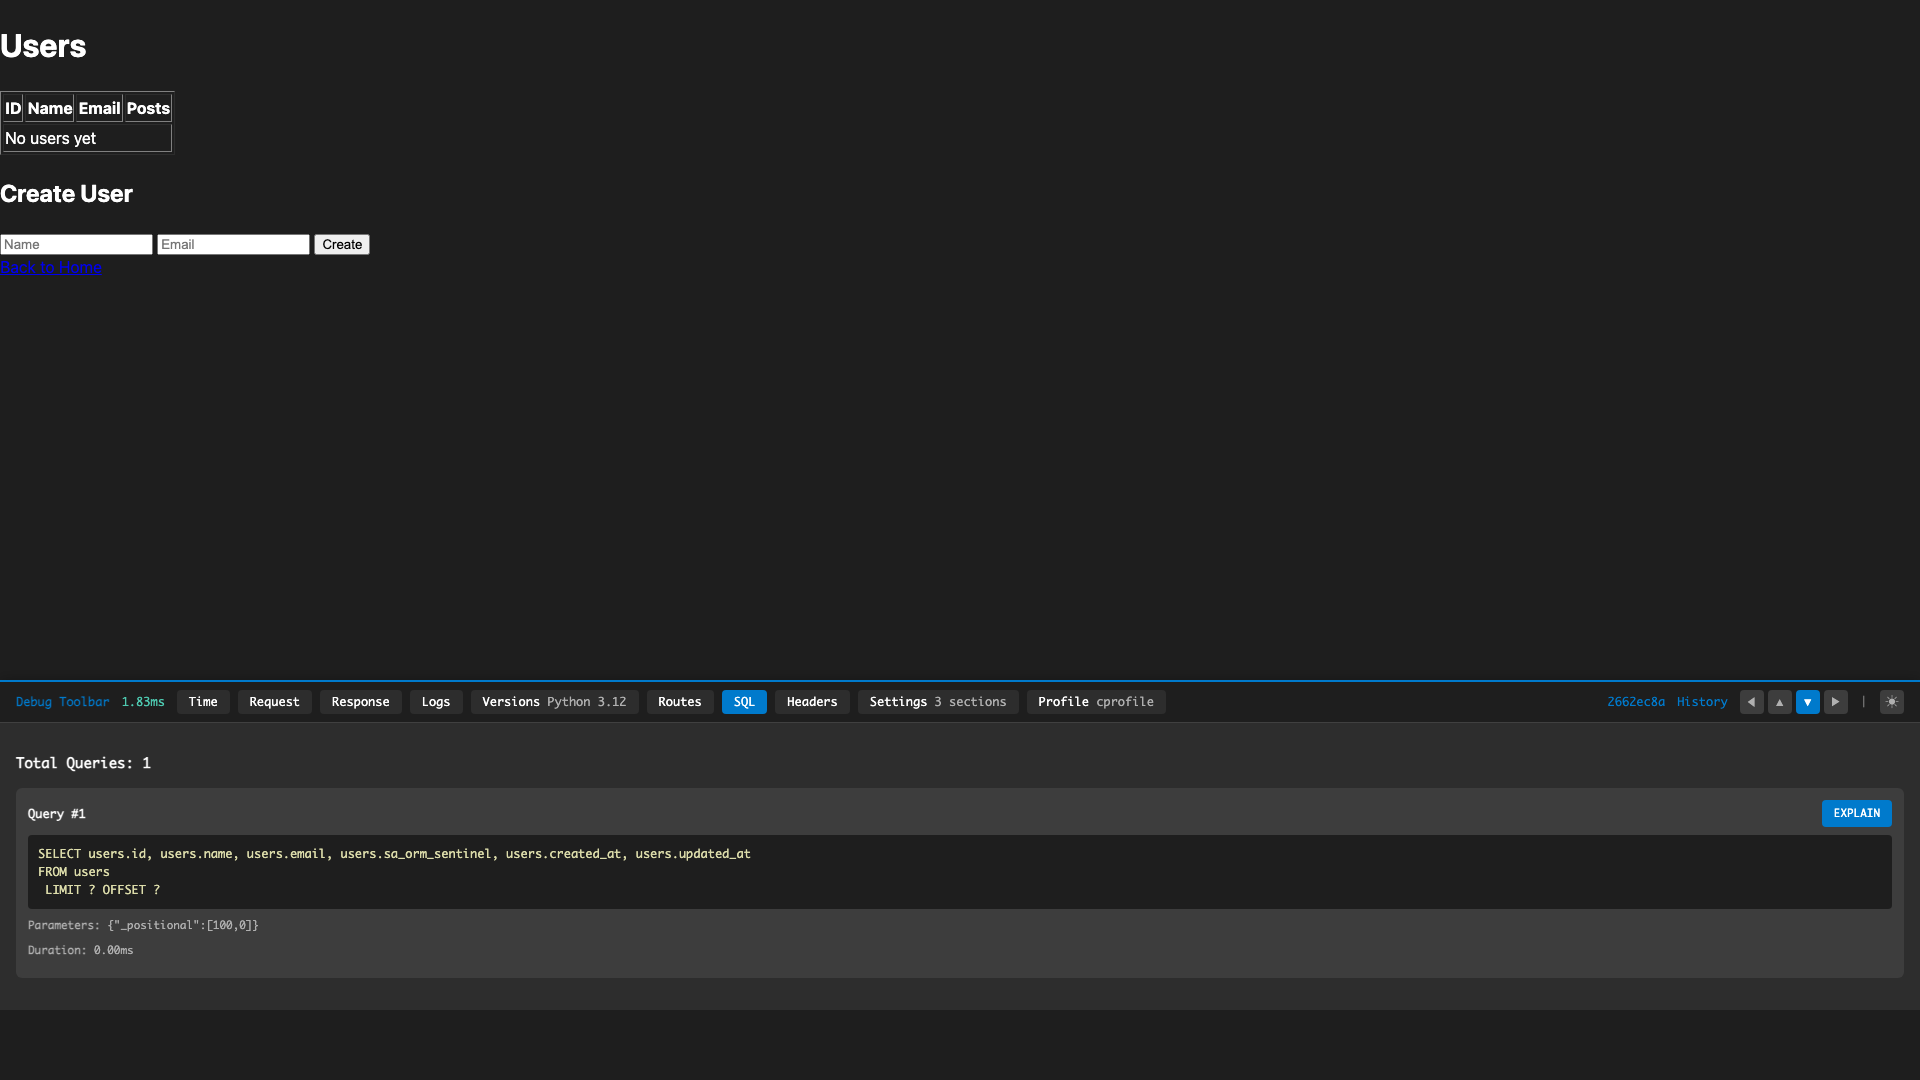
Query tracking with EXPLAIN
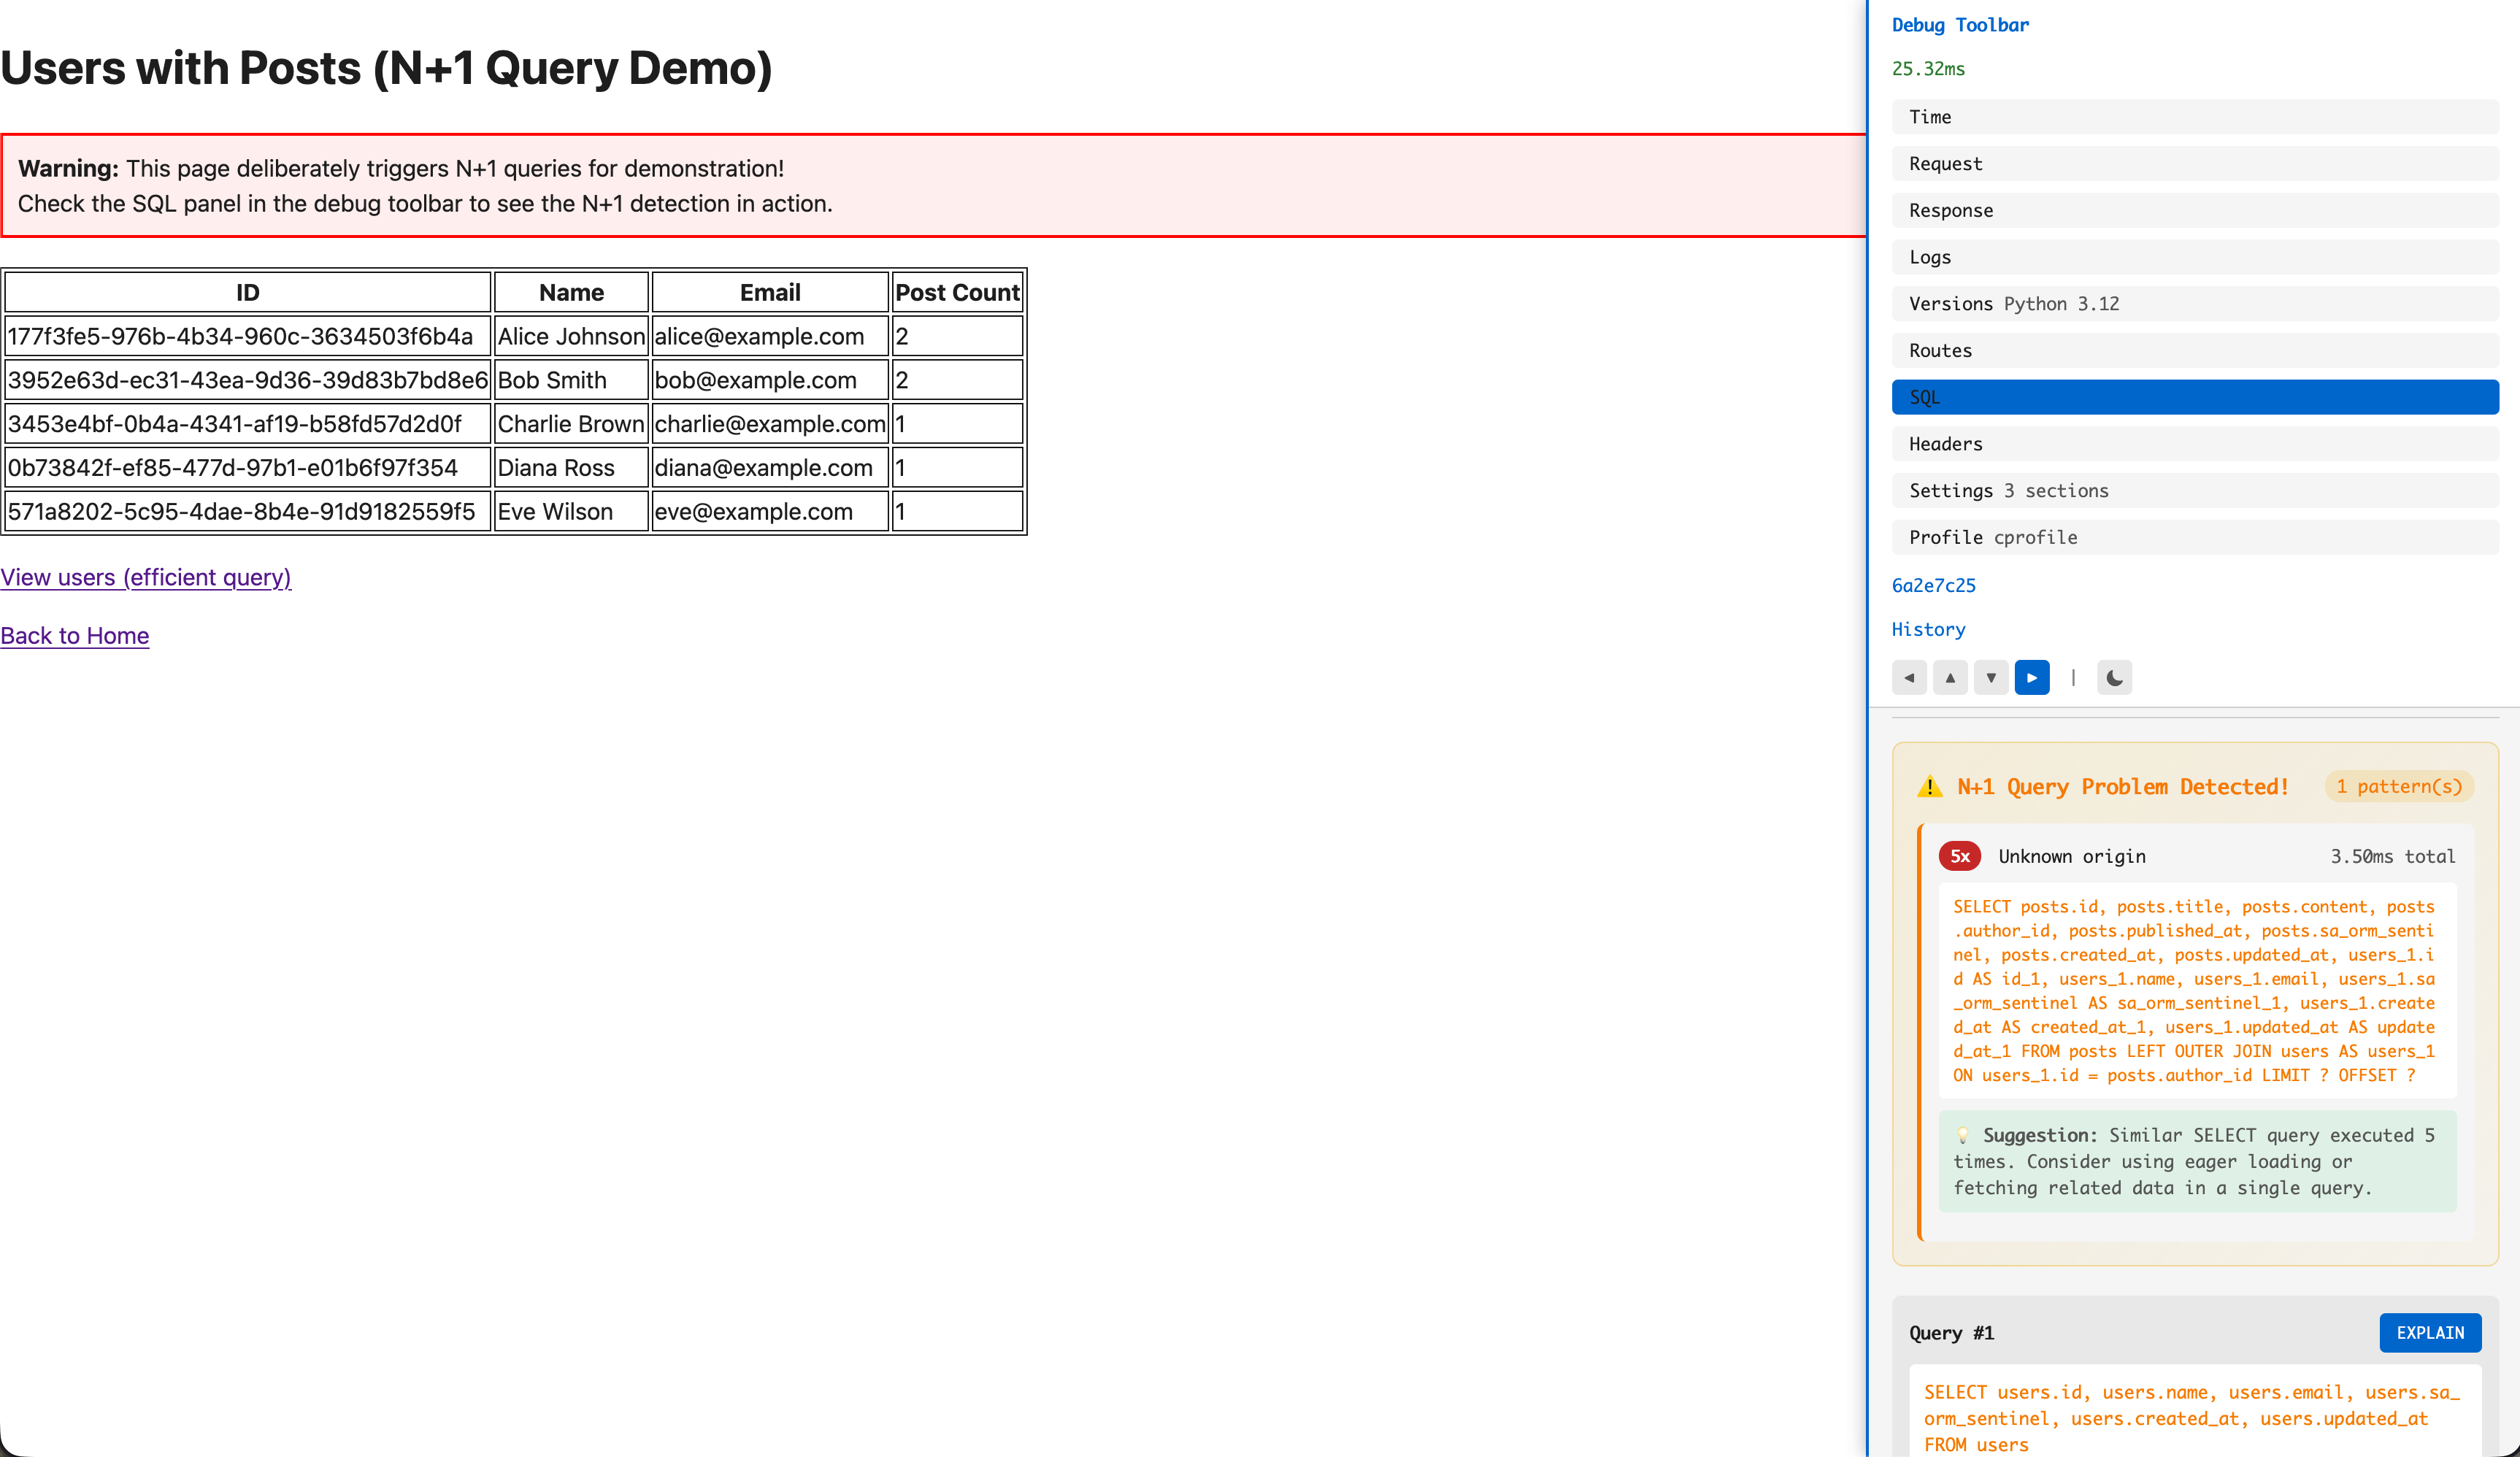
Automatic N+1 query detection with fix suggestions
Toggle dark/light themes
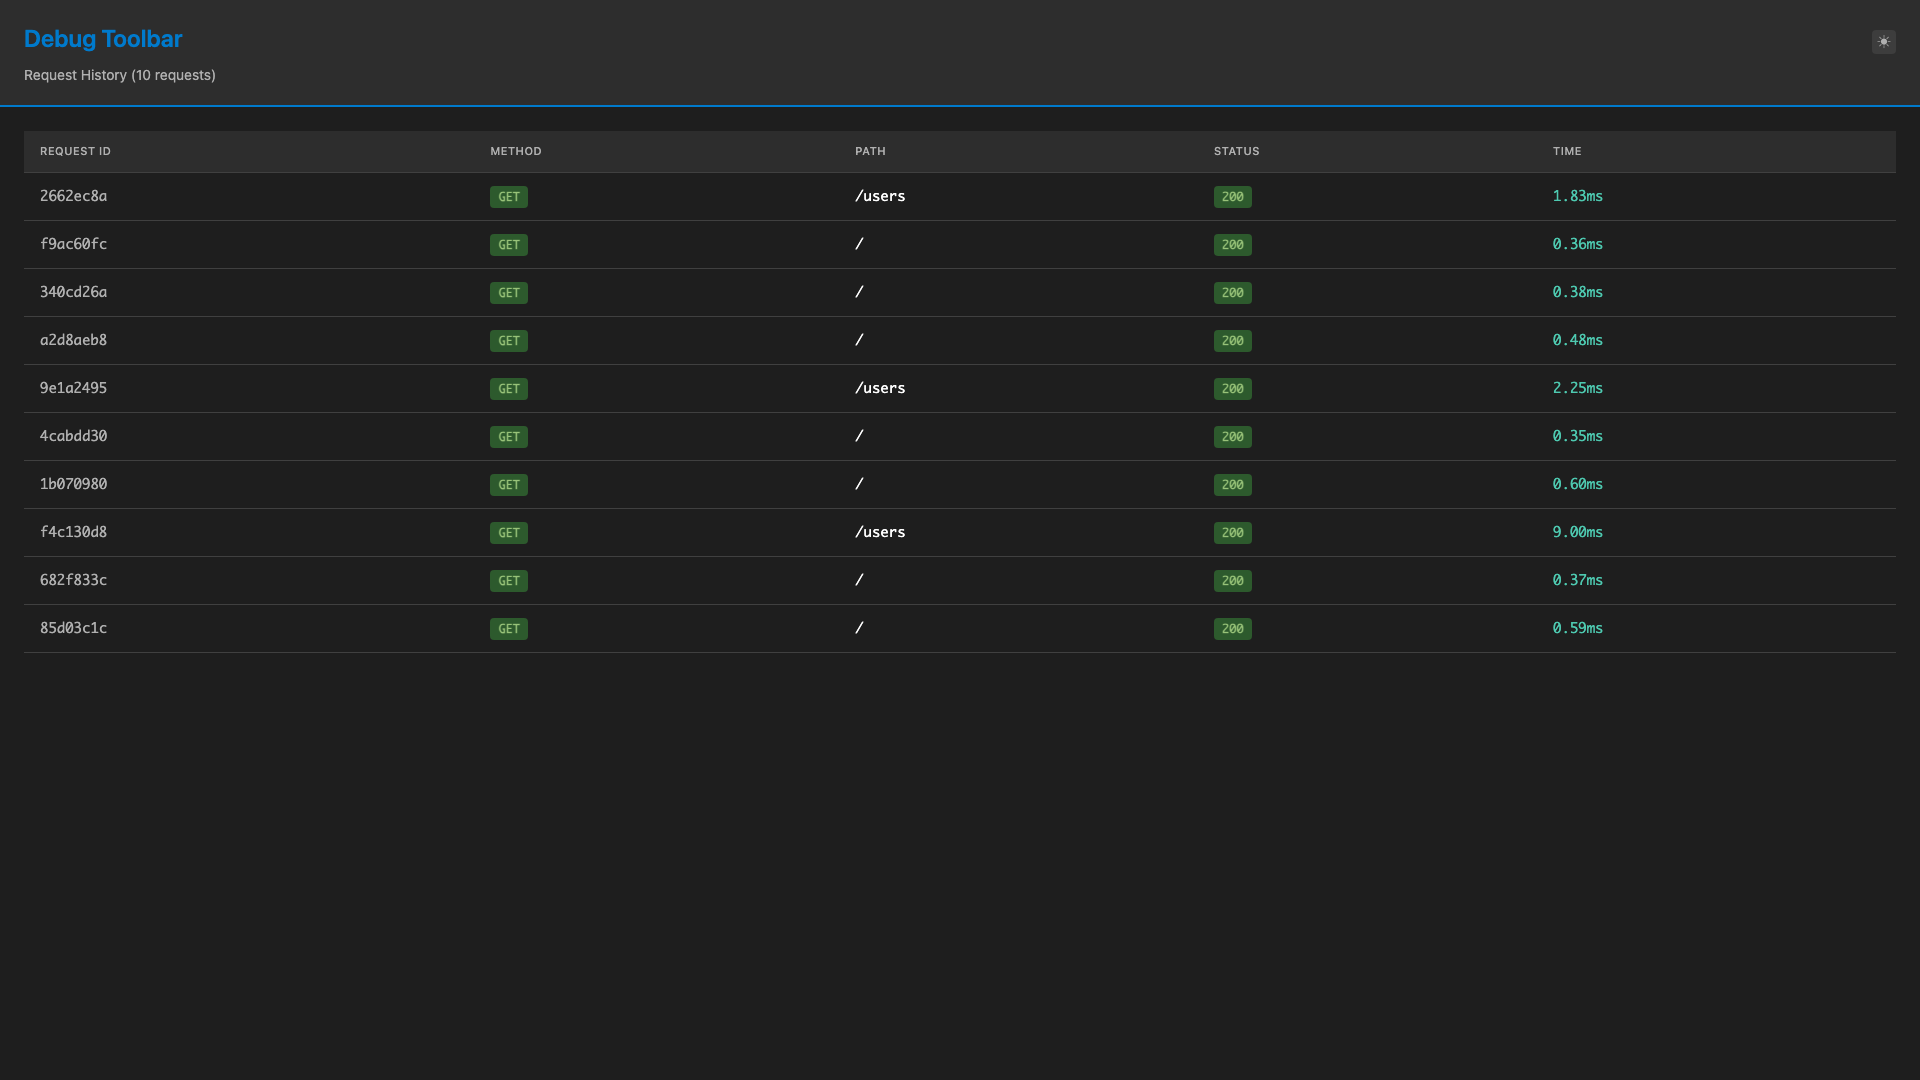
Browse past requests
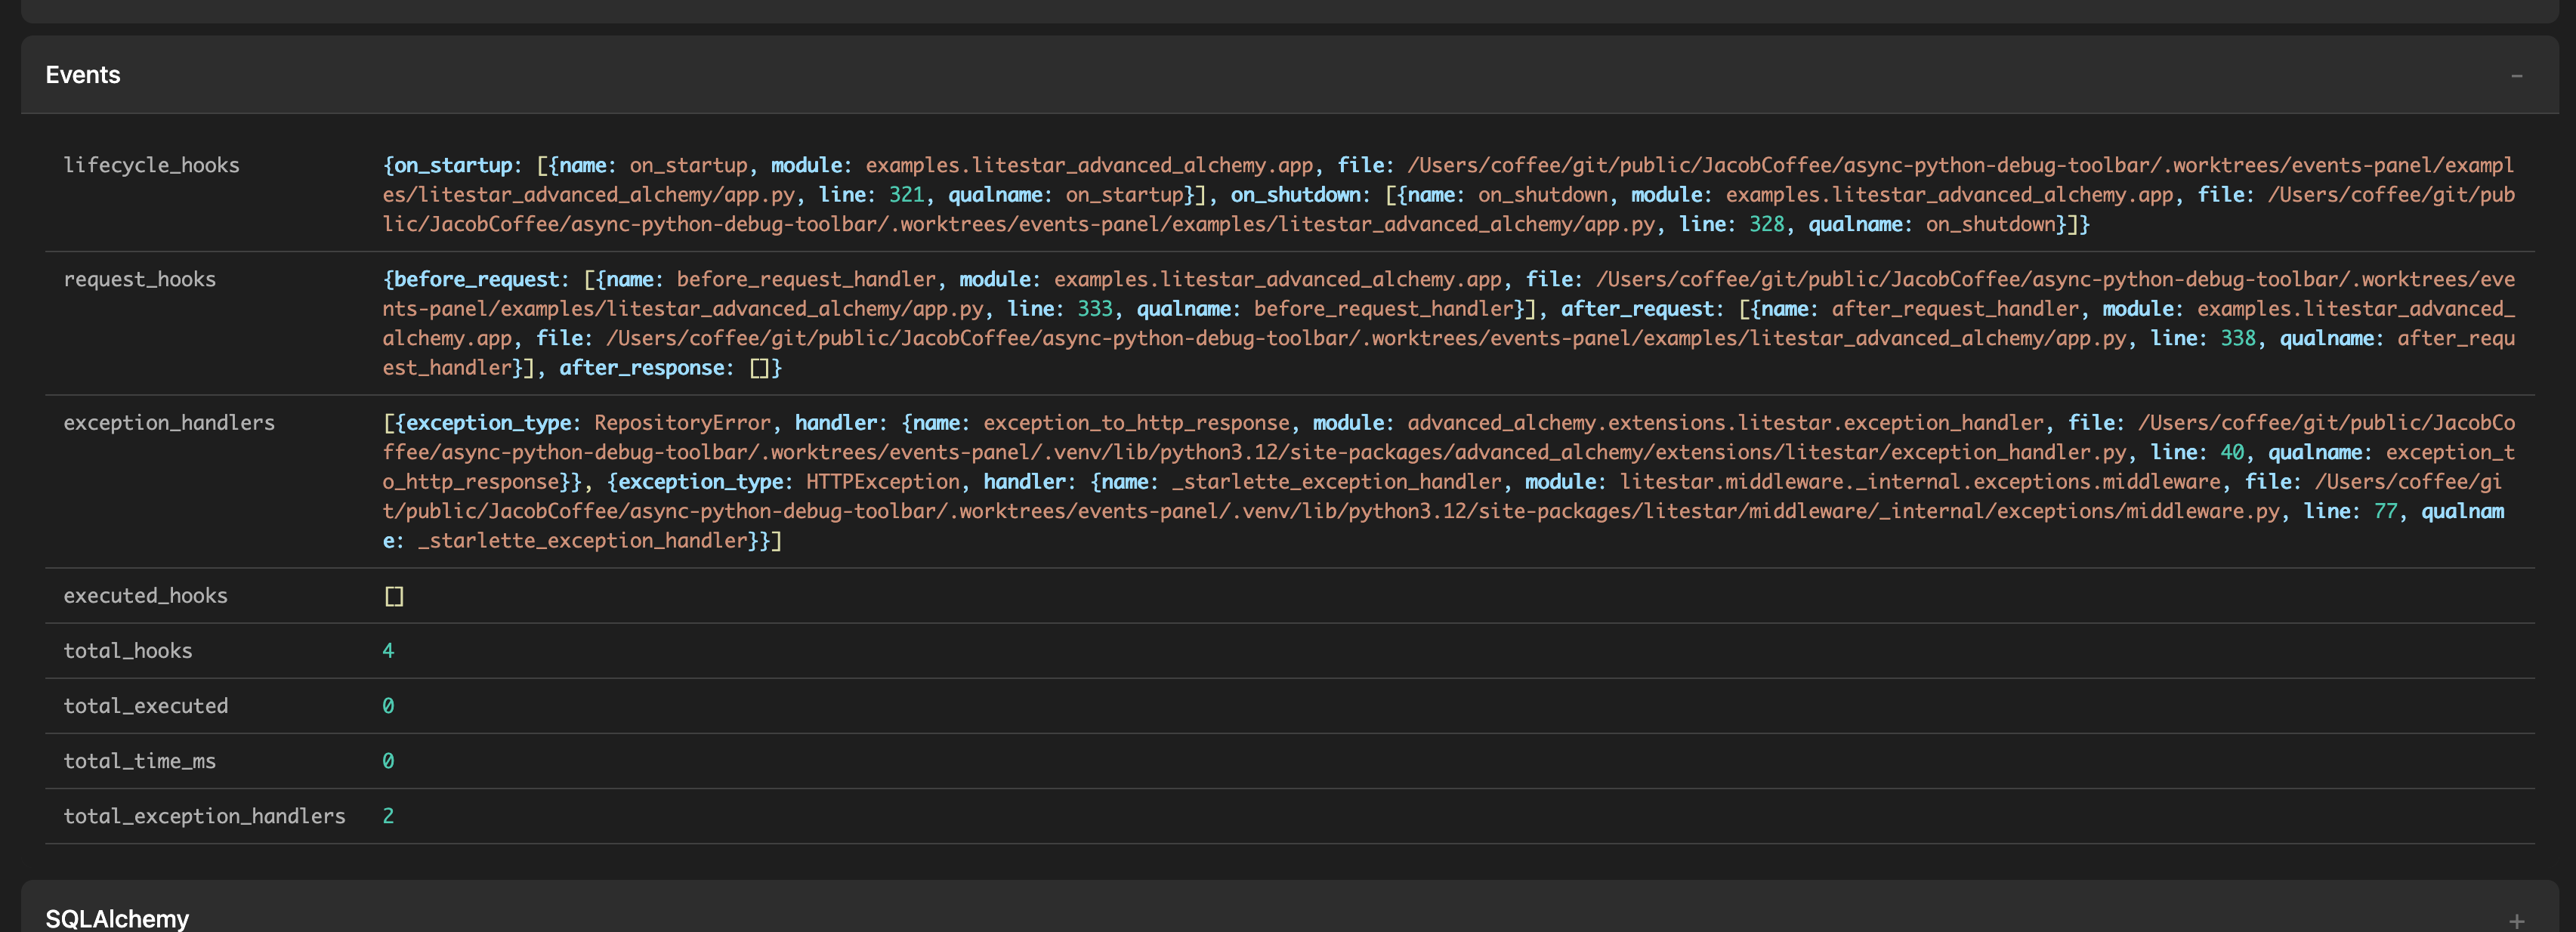
Lifecycle hooks and exception handlers
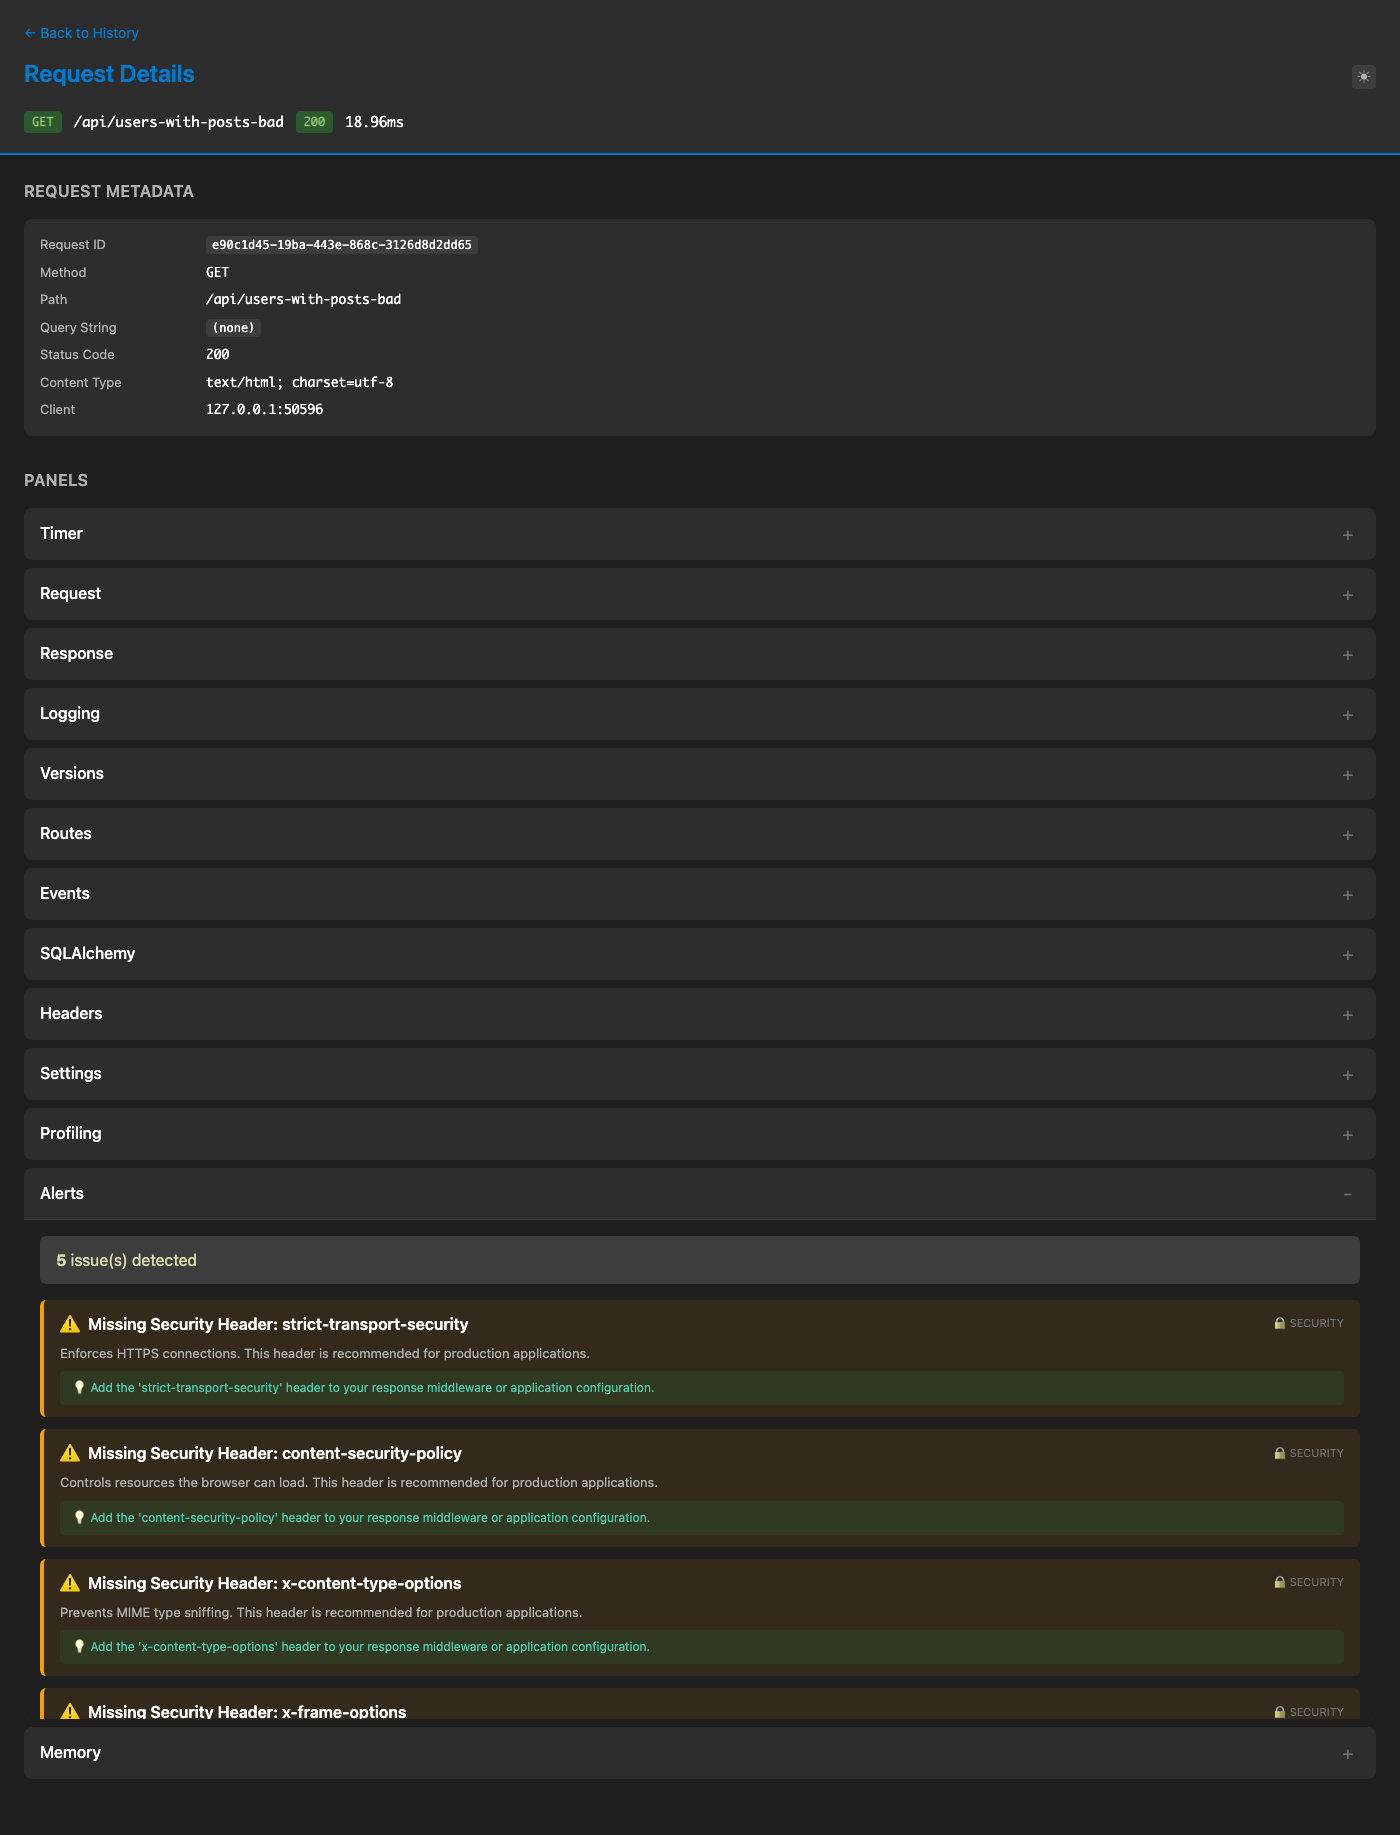
Proactive security and performance issue detection
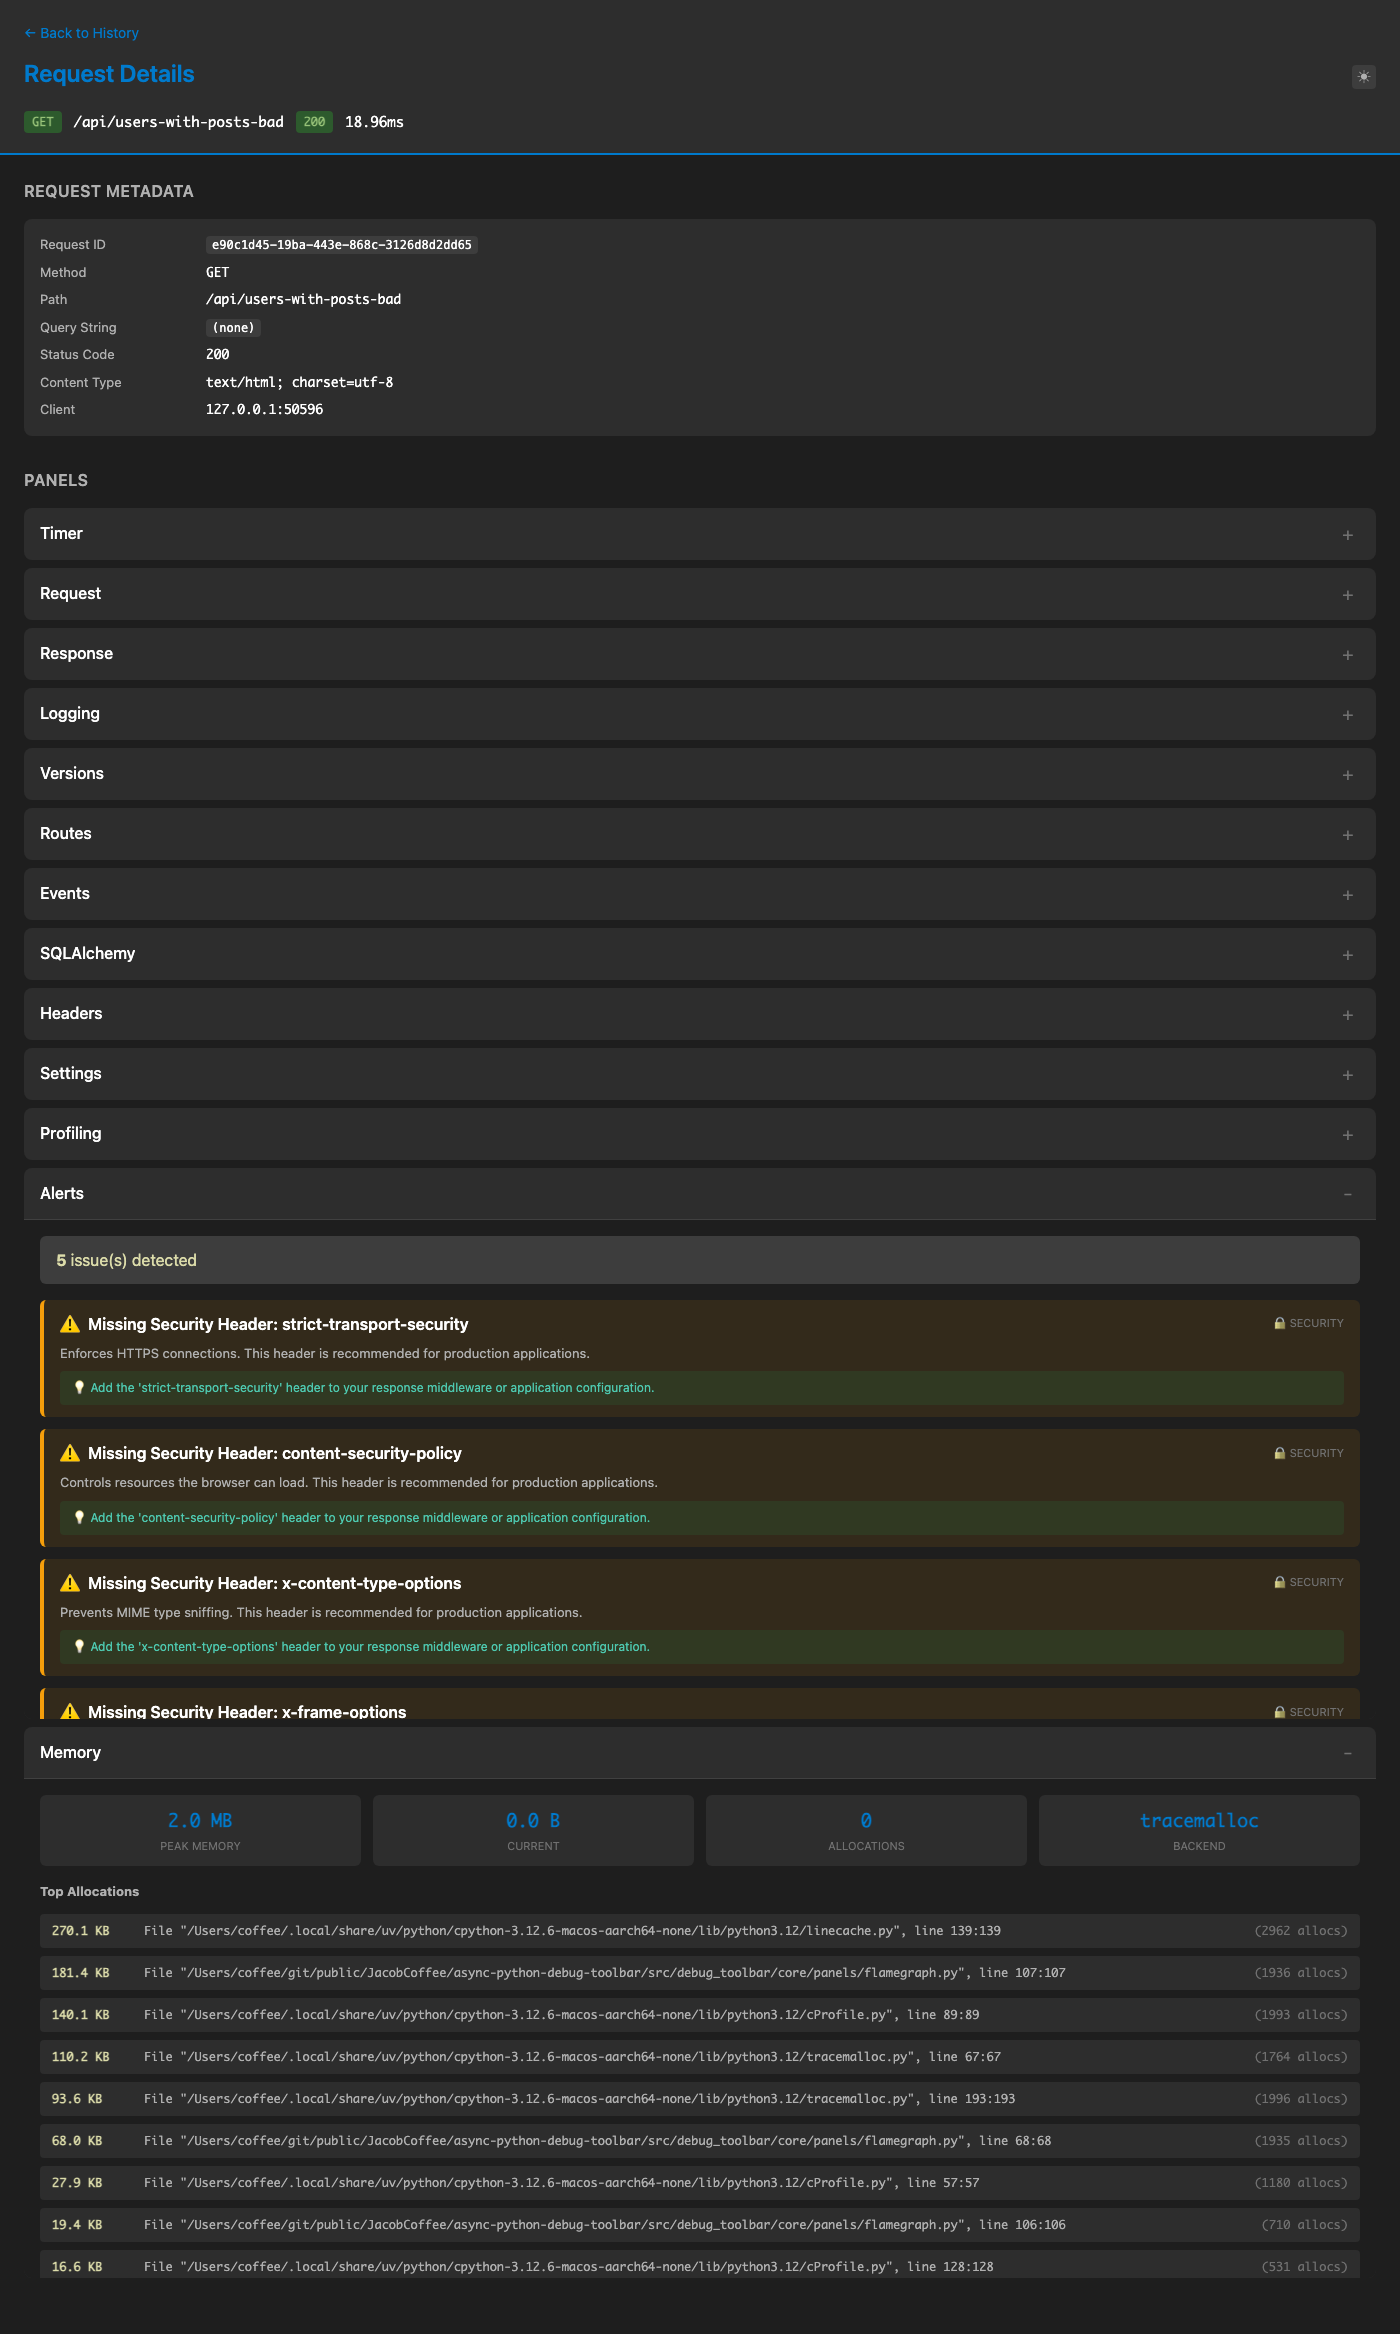
Memory allocation tracking (tracemalloc/memray)
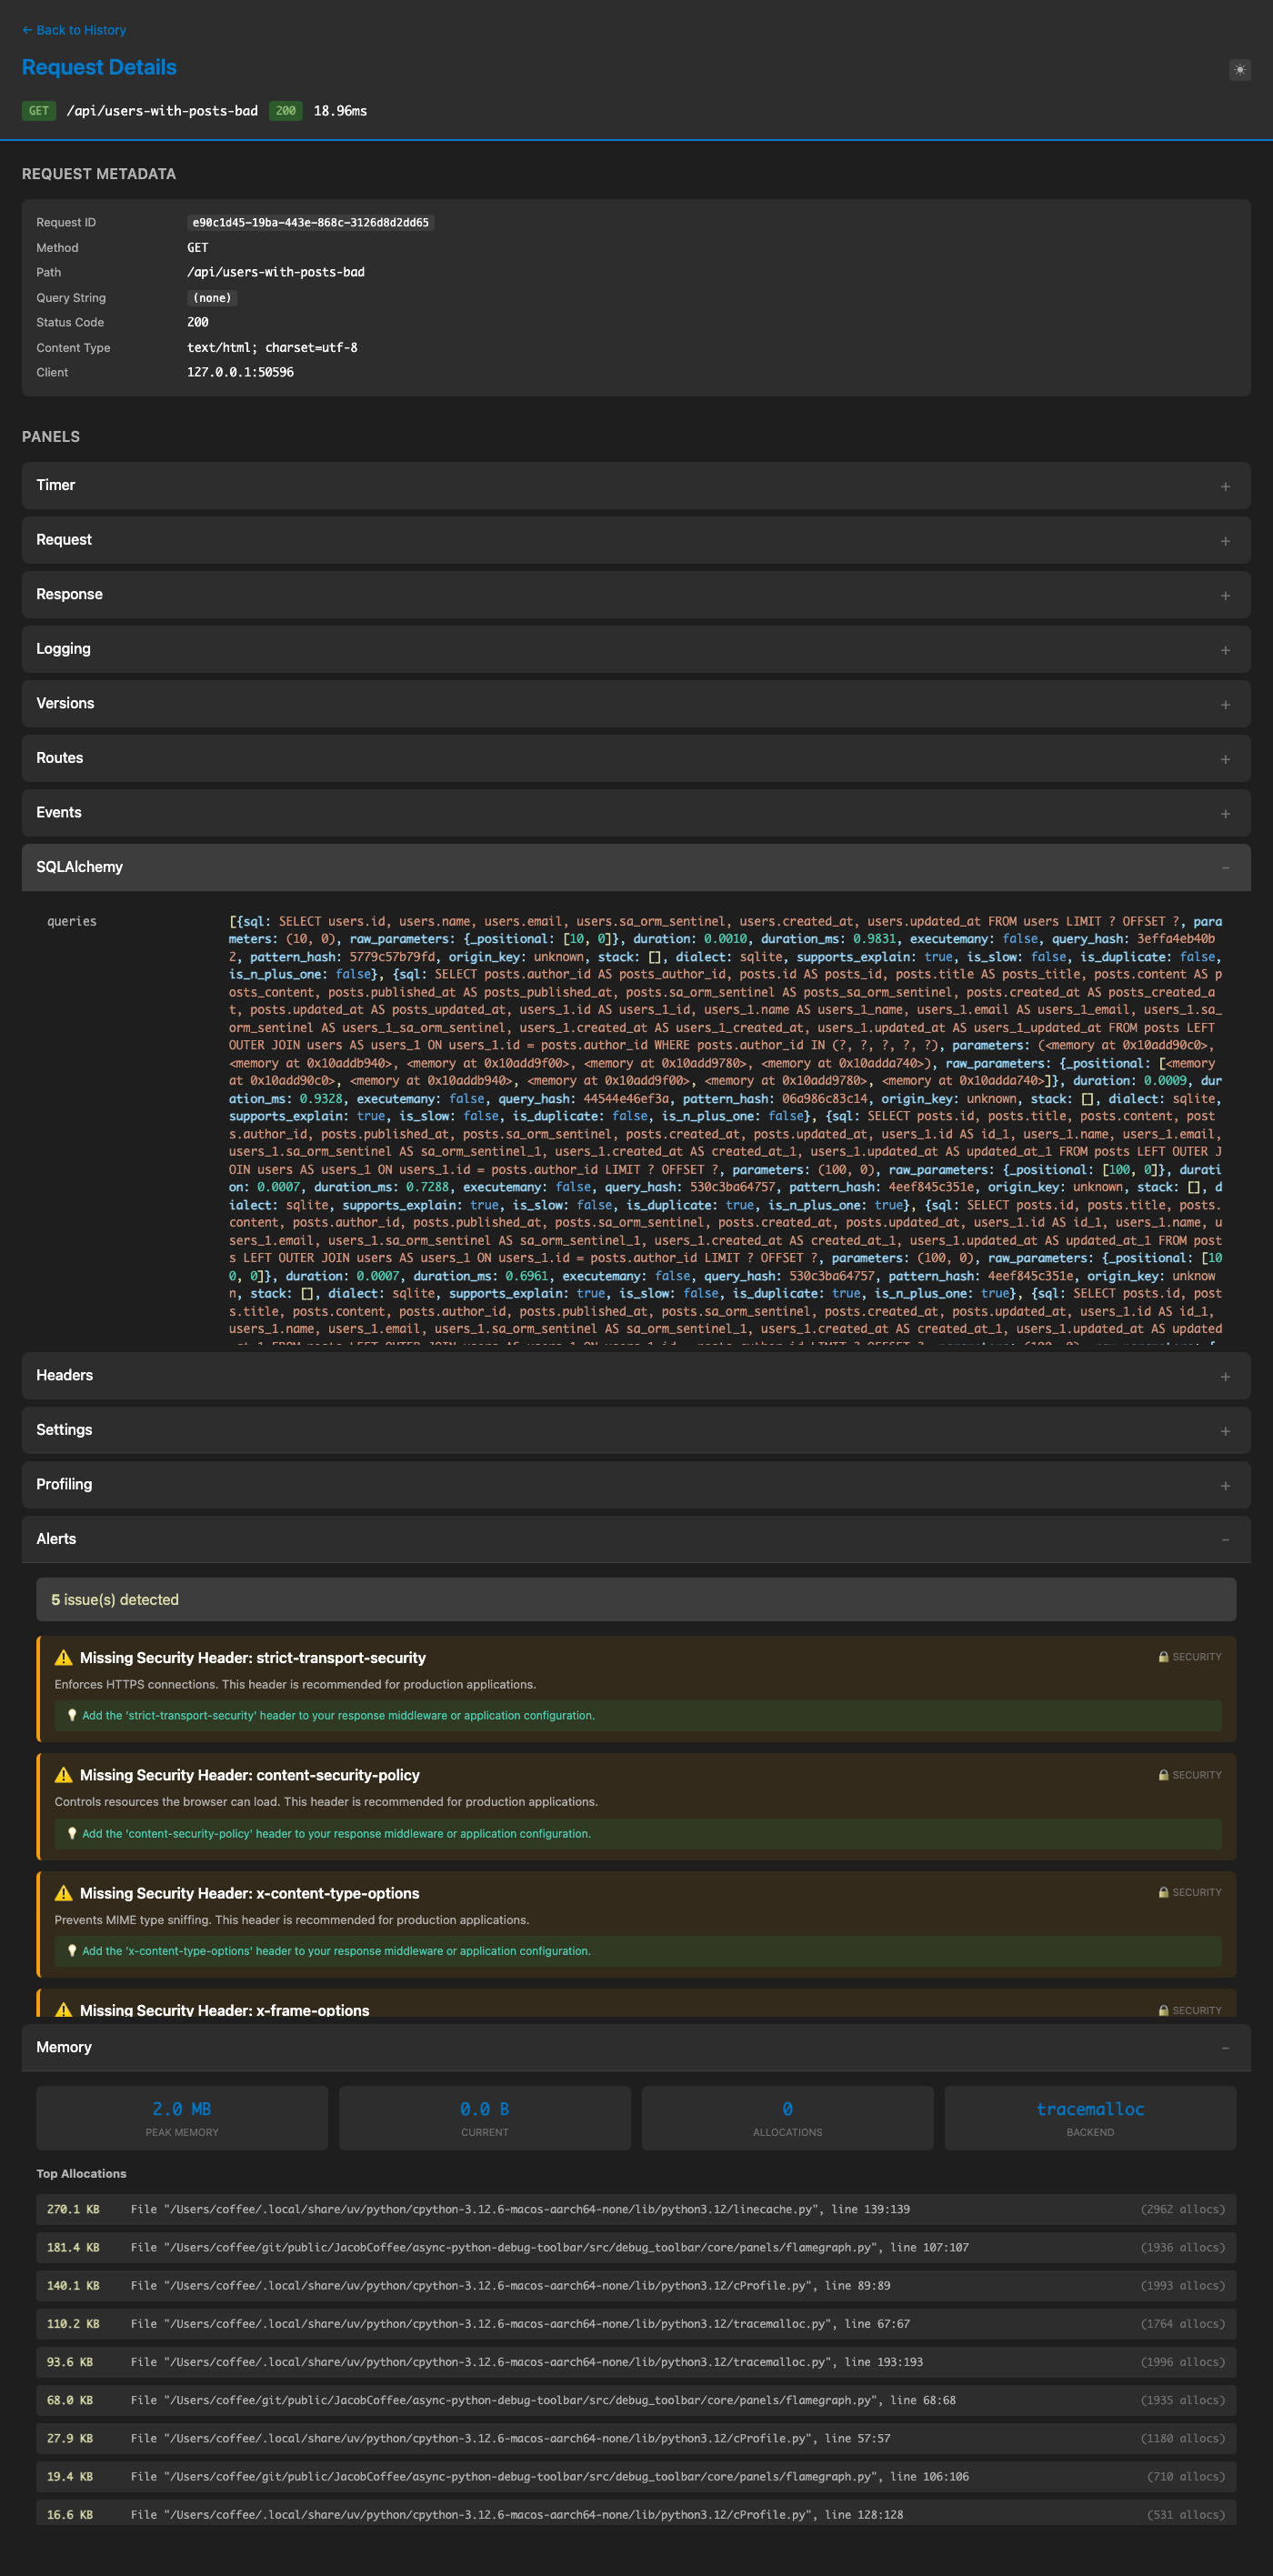
Query analysis with N+1 detection and EXPLAIN
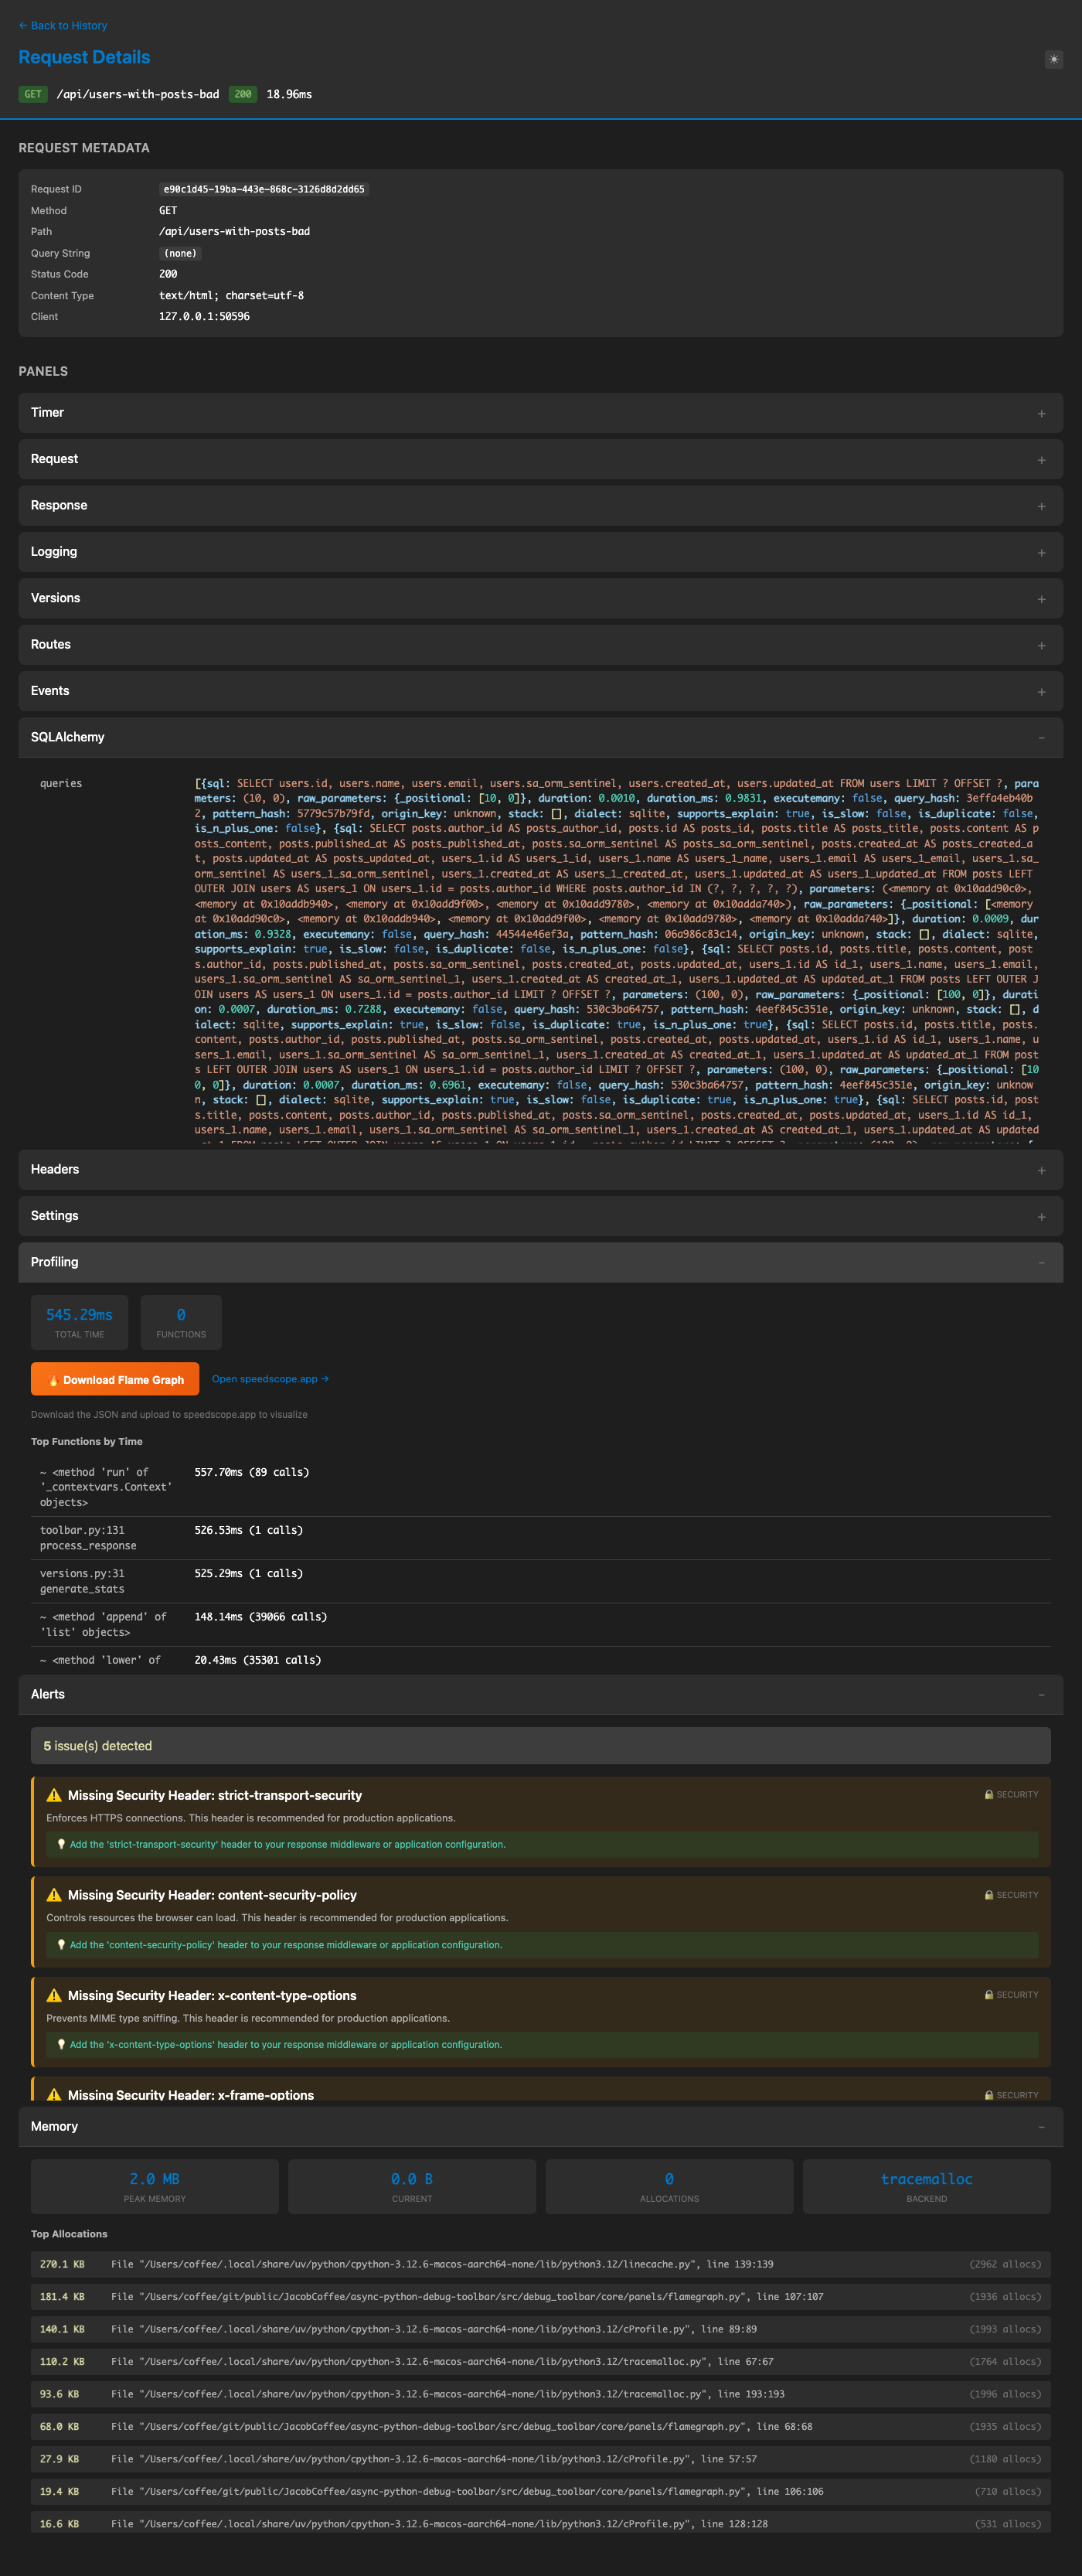
cProfile with flame graph visualization