Built-in Panels
The debug toolbar ships with a comprehensive set of panels for debugging and profiling your application.
Panel Quick Reference
Panel |
Category |
Auto-Enabled |
Description |
|---|---|---|---|
Timer |
Default |
Yes |
Request timing and CPU time |
Request |
Default |
Yes |
HTTP method, path, headers, cookies |
Response |
Default |
Yes |
Status code, response headers |
Logging |
Default |
Yes |
Log records captured during request |
Versions |
Default |
Yes |
Python and package versions |
Headers |
Optional |
No |
Categorized headers with security analysis |
Settings |
Optional |
No |
Application configuration viewer |
Templates |
Optional |
No |
Jinja2/Mako render tracking |
Profiling |
Optional |
No |
cProfile/pyinstrument with flame graphs |
Alerts |
Optional |
No |
Proactive issue detection |
Memory |
Optional |
No |
Memory profiling (tracemalloc/memray) |
Cache |
Optional |
No |
Redis/memcached tracking |
WebSocket |
Auto |
Yes* |
Real-time WebSocket connection tracking |
Routes |
Litestar |
Yes |
Application routes |
Events |
Litestar |
Yes |
Lifecycle hooks and exception handlers |
SQLAlchemy |
Extra |
No |
Query tracking with N+1 detection |
Default Panels
These panels are enabled by default and provide essential debugging information.
Timer Panel
ID: TimerPanel
Displays request timing information:
Total request duration
CPU time (user + system)
Server-Timing header data
Request Panel
ID: RequestPanel
Shows incoming request details:
HTTP method and path
Query parameters
Headers
Cookies
Client information
Response Panel
ID: ResponsePanel
Displays response information:
Status code
Response headers
Content type
Content length
Logging Panel
ID: LoggingPanel
Captures log records during the request:
Log level
Logger name
Message
Source location
Error/warning counts
Versions Panel
ID: VersionsPanel
Shows environment information:
Python version
Platform details
Installed packages
Optional Core Panels
These panels are available out of the box but must be explicitly enabled via extra_panels in your configuration.
Headers Panel
ID: HeadersPanel
Detailed HTTP header inspection with security analysis:
Request headers categorized by type (content, caching, auth, CORS, etc.)
Response headers with security analysis
Missing security headers detection (CSP, X-Content-Type-Options, etc.)
Cookie parsing and analysis
Authorization header parsing (Basic, Bearer, etc.)
Cache-Control directive breakdown
Enable in config:
config = LitestarDebugToolbarConfig(
    extra_panels=["debug_toolbar.core.panels.headers.HeadersPanel"],
)
Settings Panel
ID: SettingsPanel
Application configuration viewer:
Toolbar configuration settings
App settings and environment
Sensitive data redaction (passwords, secrets, API keys)
Django-style settings support (when applicable)
Enable in config:
config = LitestarDebugToolbarConfig(
    extra_panels=["debug_toolbar.core.panels.settings.SettingsPanel"],
)
Templates Panel
ID: TemplatesPanel
Template rendering tracking for Jinja2 and Mako:
Template render times
Template names and paths
Context variables passed to templates
Render count statistics
Enable in config:
config = LitestarDebugToolbarConfig(
    extra_panels=["debug_toolbar.core.panels.templates.TemplatesPanel"],
)
Profiling Panel
ID: ProfilingPanel
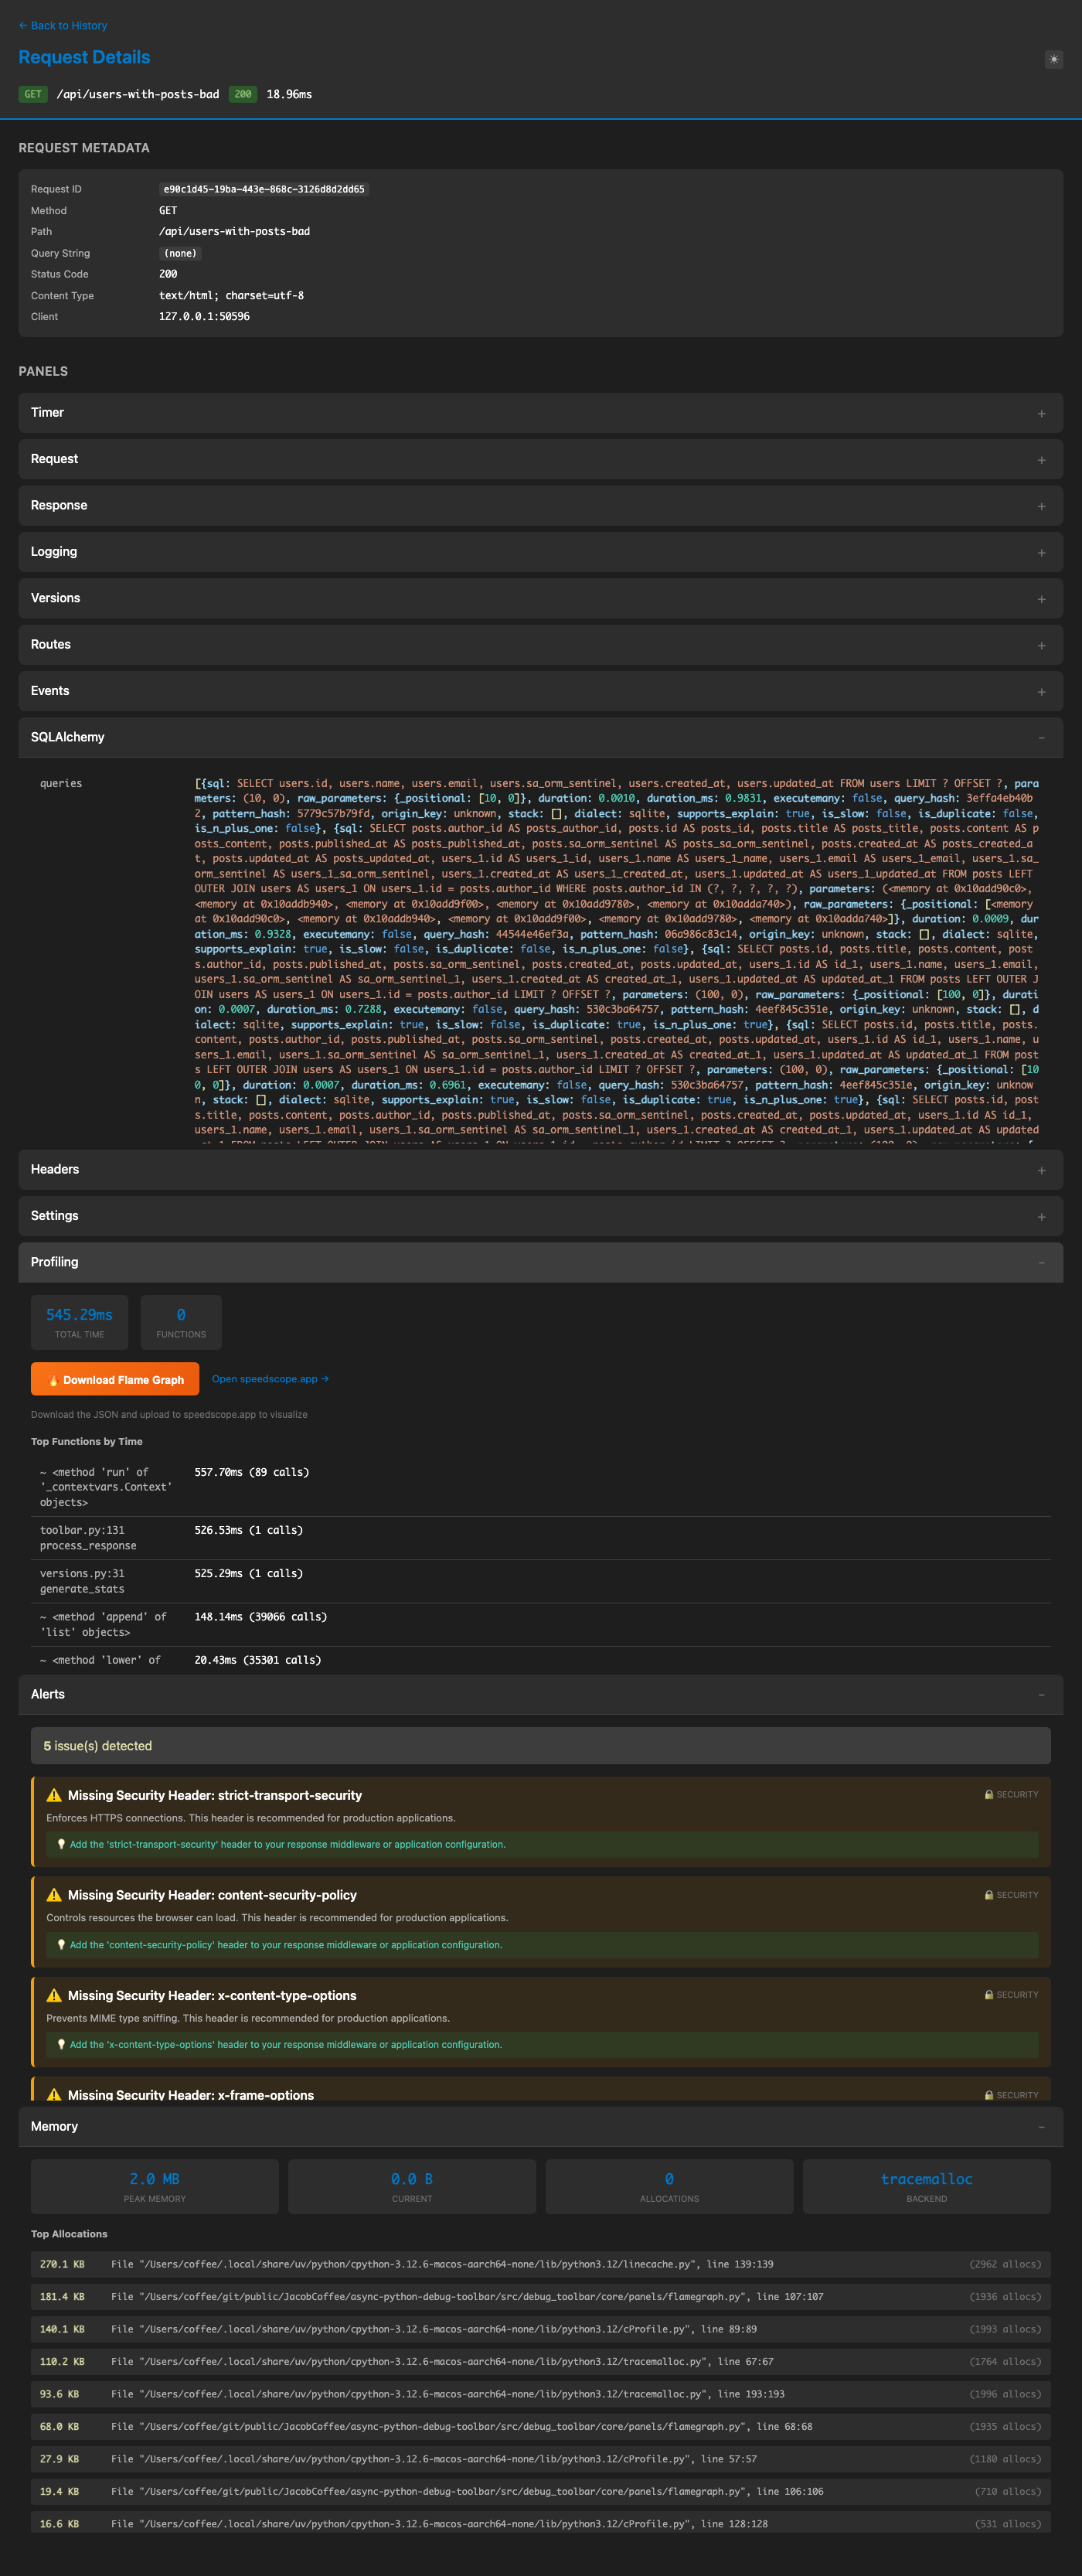
Request profiling with flame graph visualization:
cProfile-based request profiling
Optional pyinstrument support
Interactive flame graph generation (speedscope format)
Function call statistics
Cumulative and per-call timing
Flame Graph Support:
The profiling panel generates flame graphs in speedscope format. Access them via:
/_debug_toolbar/api/flamegraph/{request_id}
Download and visualize at speedscope.app.
Enable in config:
config = LitestarDebugToolbarConfig(
    extra_panels=["debug_toolbar.core.panels.profiling.ProfilingPanel"],
)
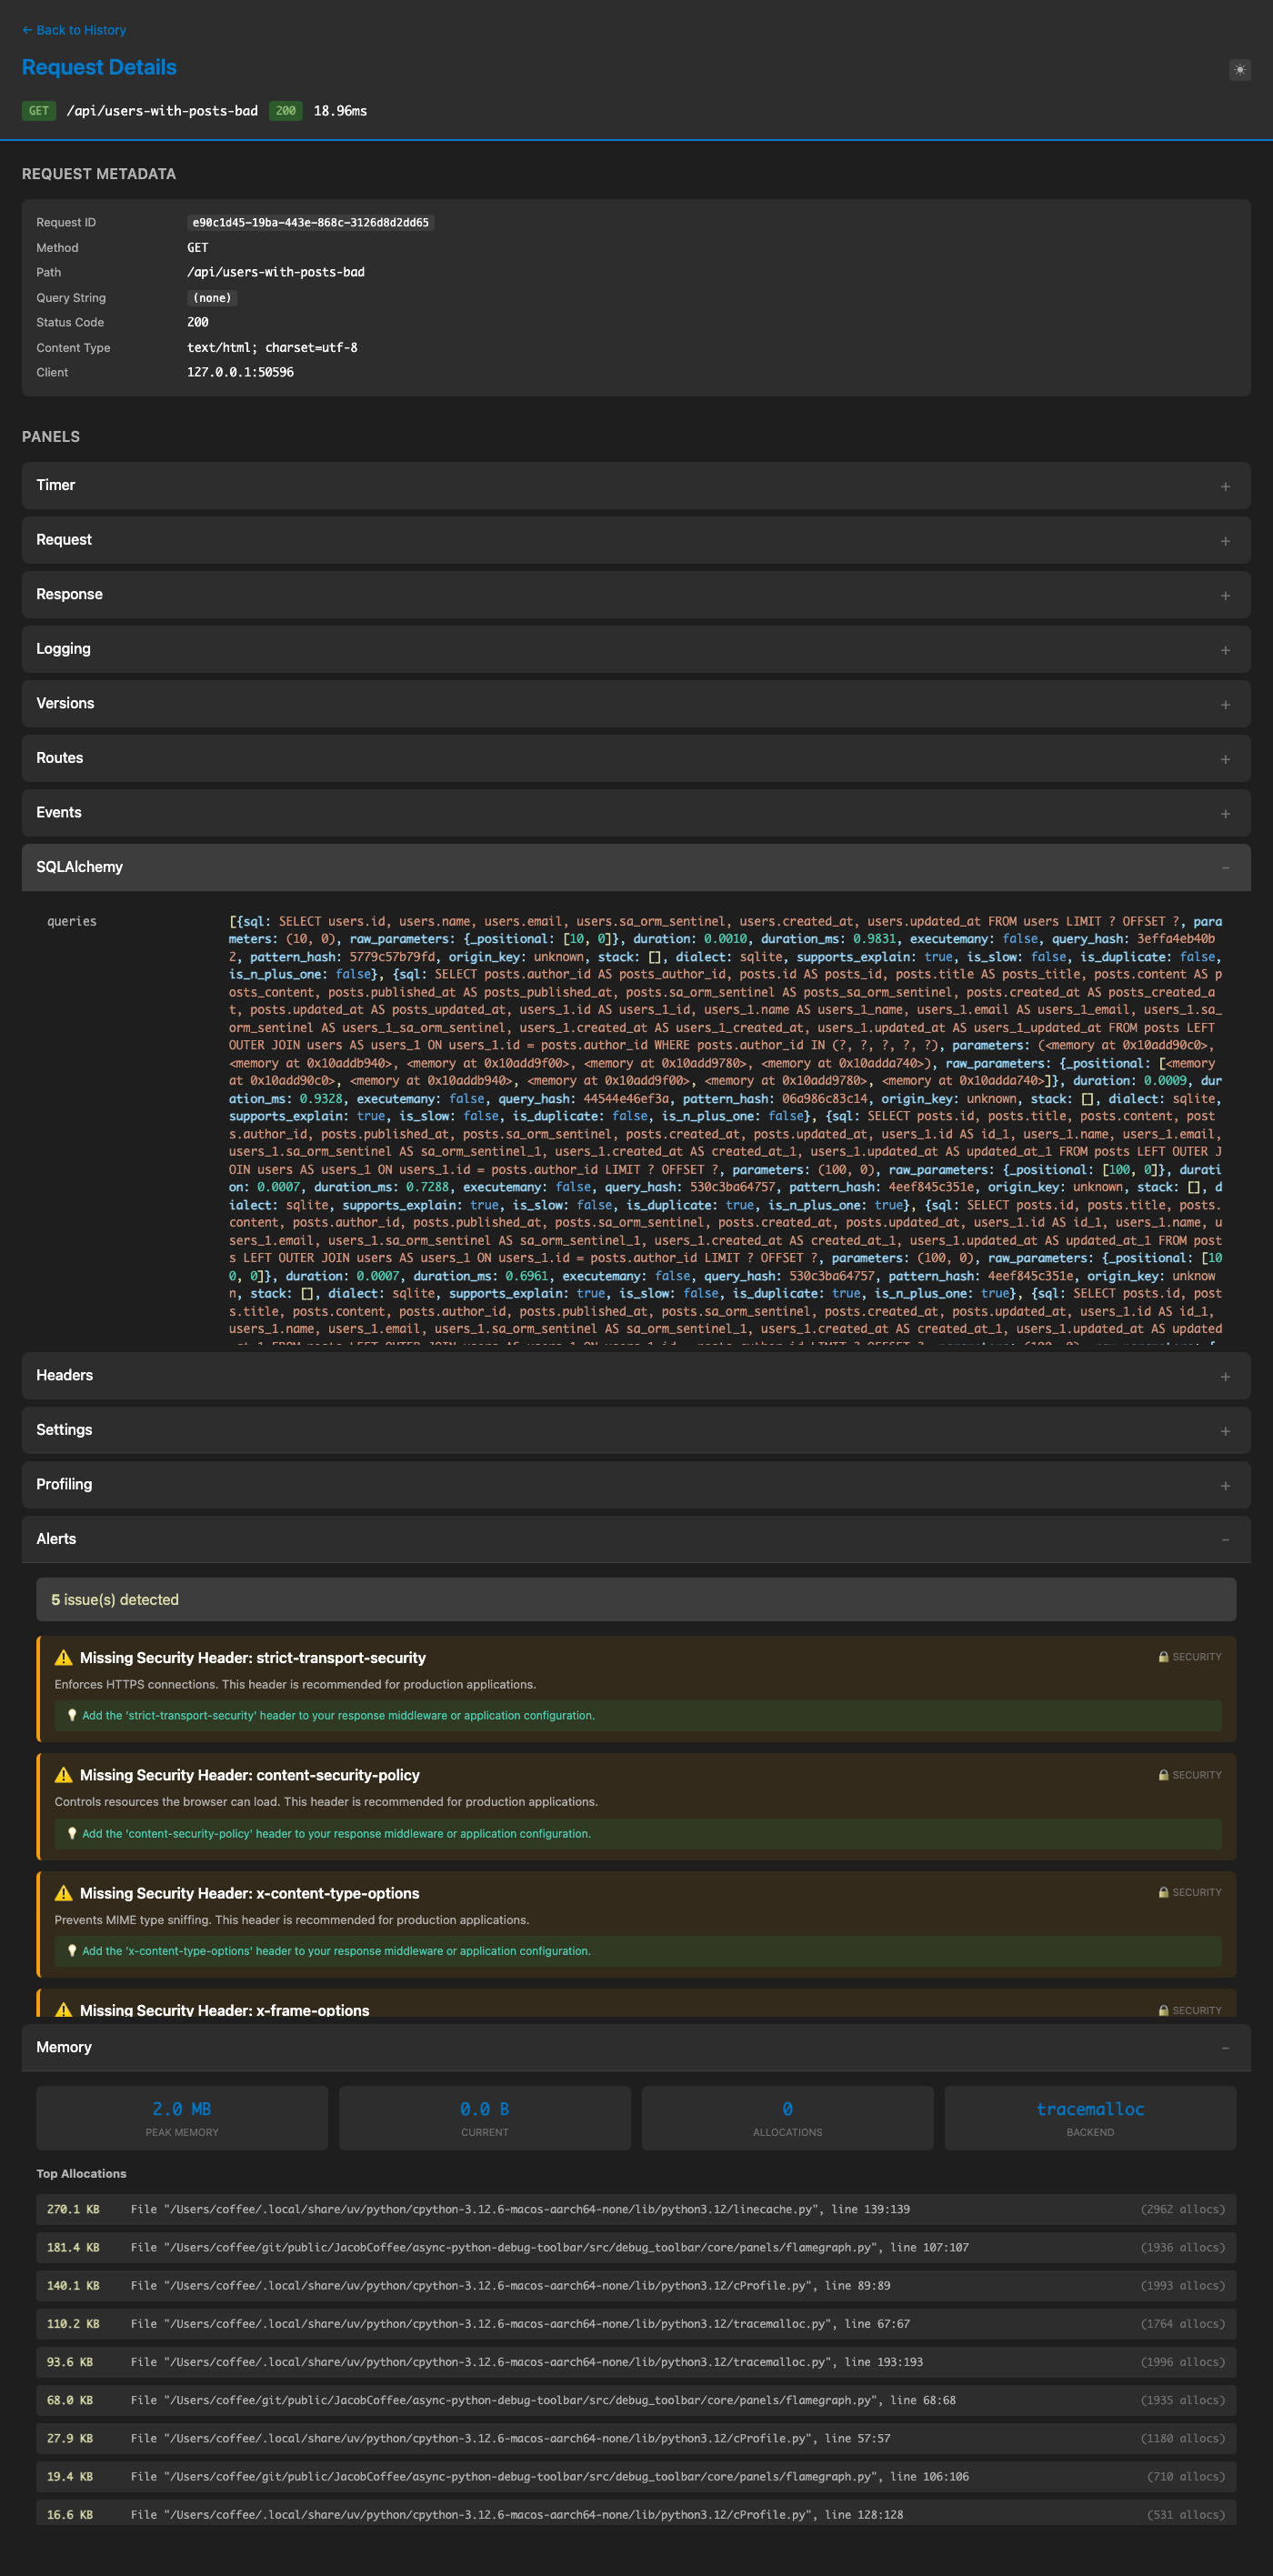
Alerts Panel
ID: AlertsPanel
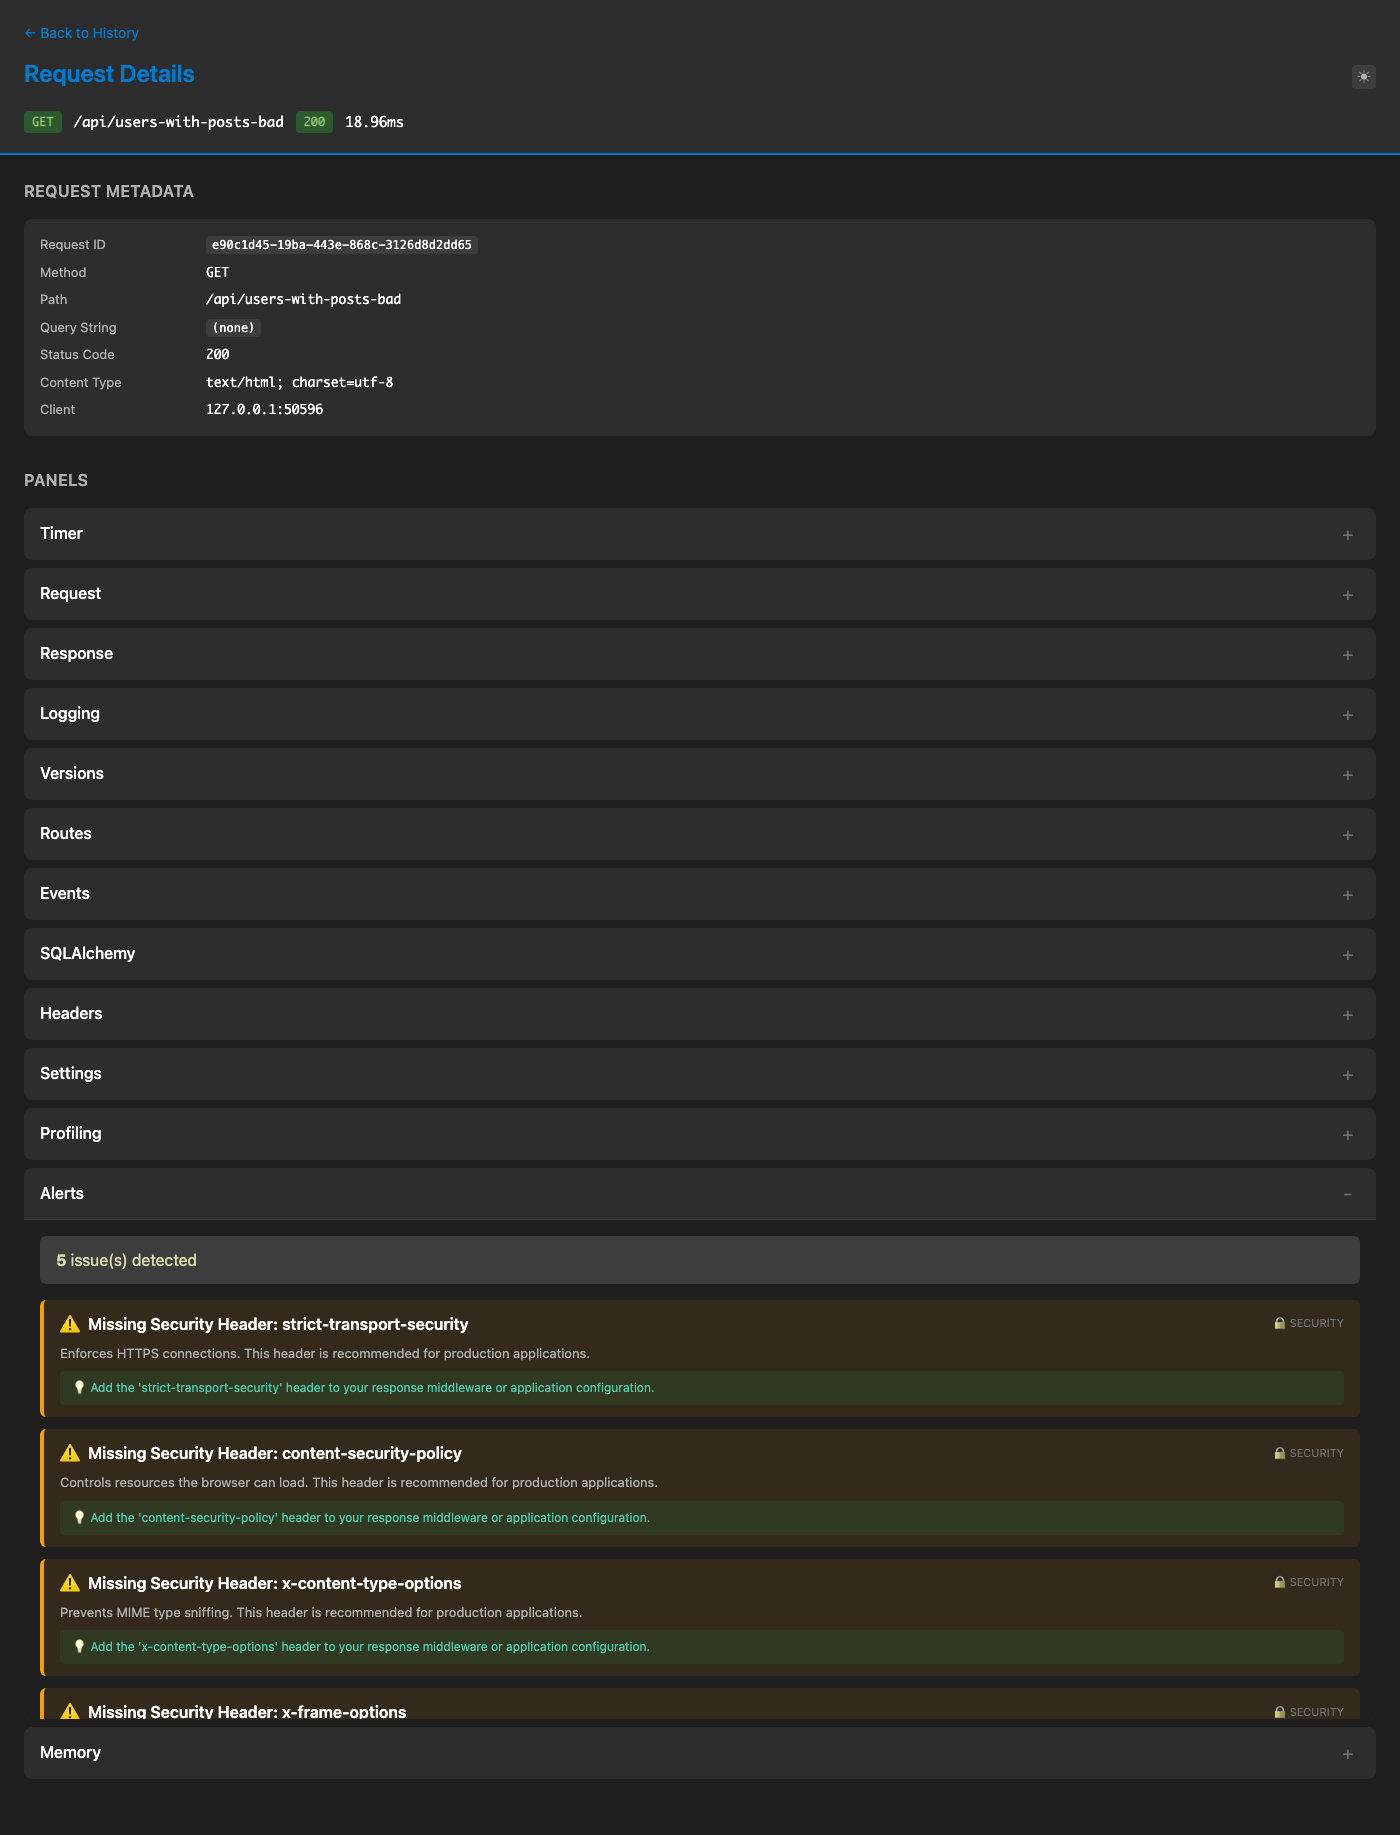
Proactive issue detection panel that automatically identifies:
Security Issues:
Missing security headers (CSP, X-Content-Type-Options, X-Frame-Options, etc.)
Insecure cookies (missing Secure, HttpOnly, SameSite flags)
CSRF protection issues on state-changing requests
Debug mode enabled in production
Performance Issues:
Large response sizes (warning at 1MB, critical at 5MB)
Slow SQL queries (warning at 100ms, critical at 500ms)
Database Issues:
N+1 query pattern detection (warning at 3+ similar queries, critical at 10+)
Optimization suggestions with eager loading recommendations
Each alert includes:
Severity level (info, warning, critical)
Category (security, performance, database, configuration)
Actionable description
Enable in config:
config = LitestarDebugToolbarConfig(
    extra_panels=["debug_toolbar.core.panels.alerts.AlertsPanel"],
)
Memory Panel
ID: MemoryPanel
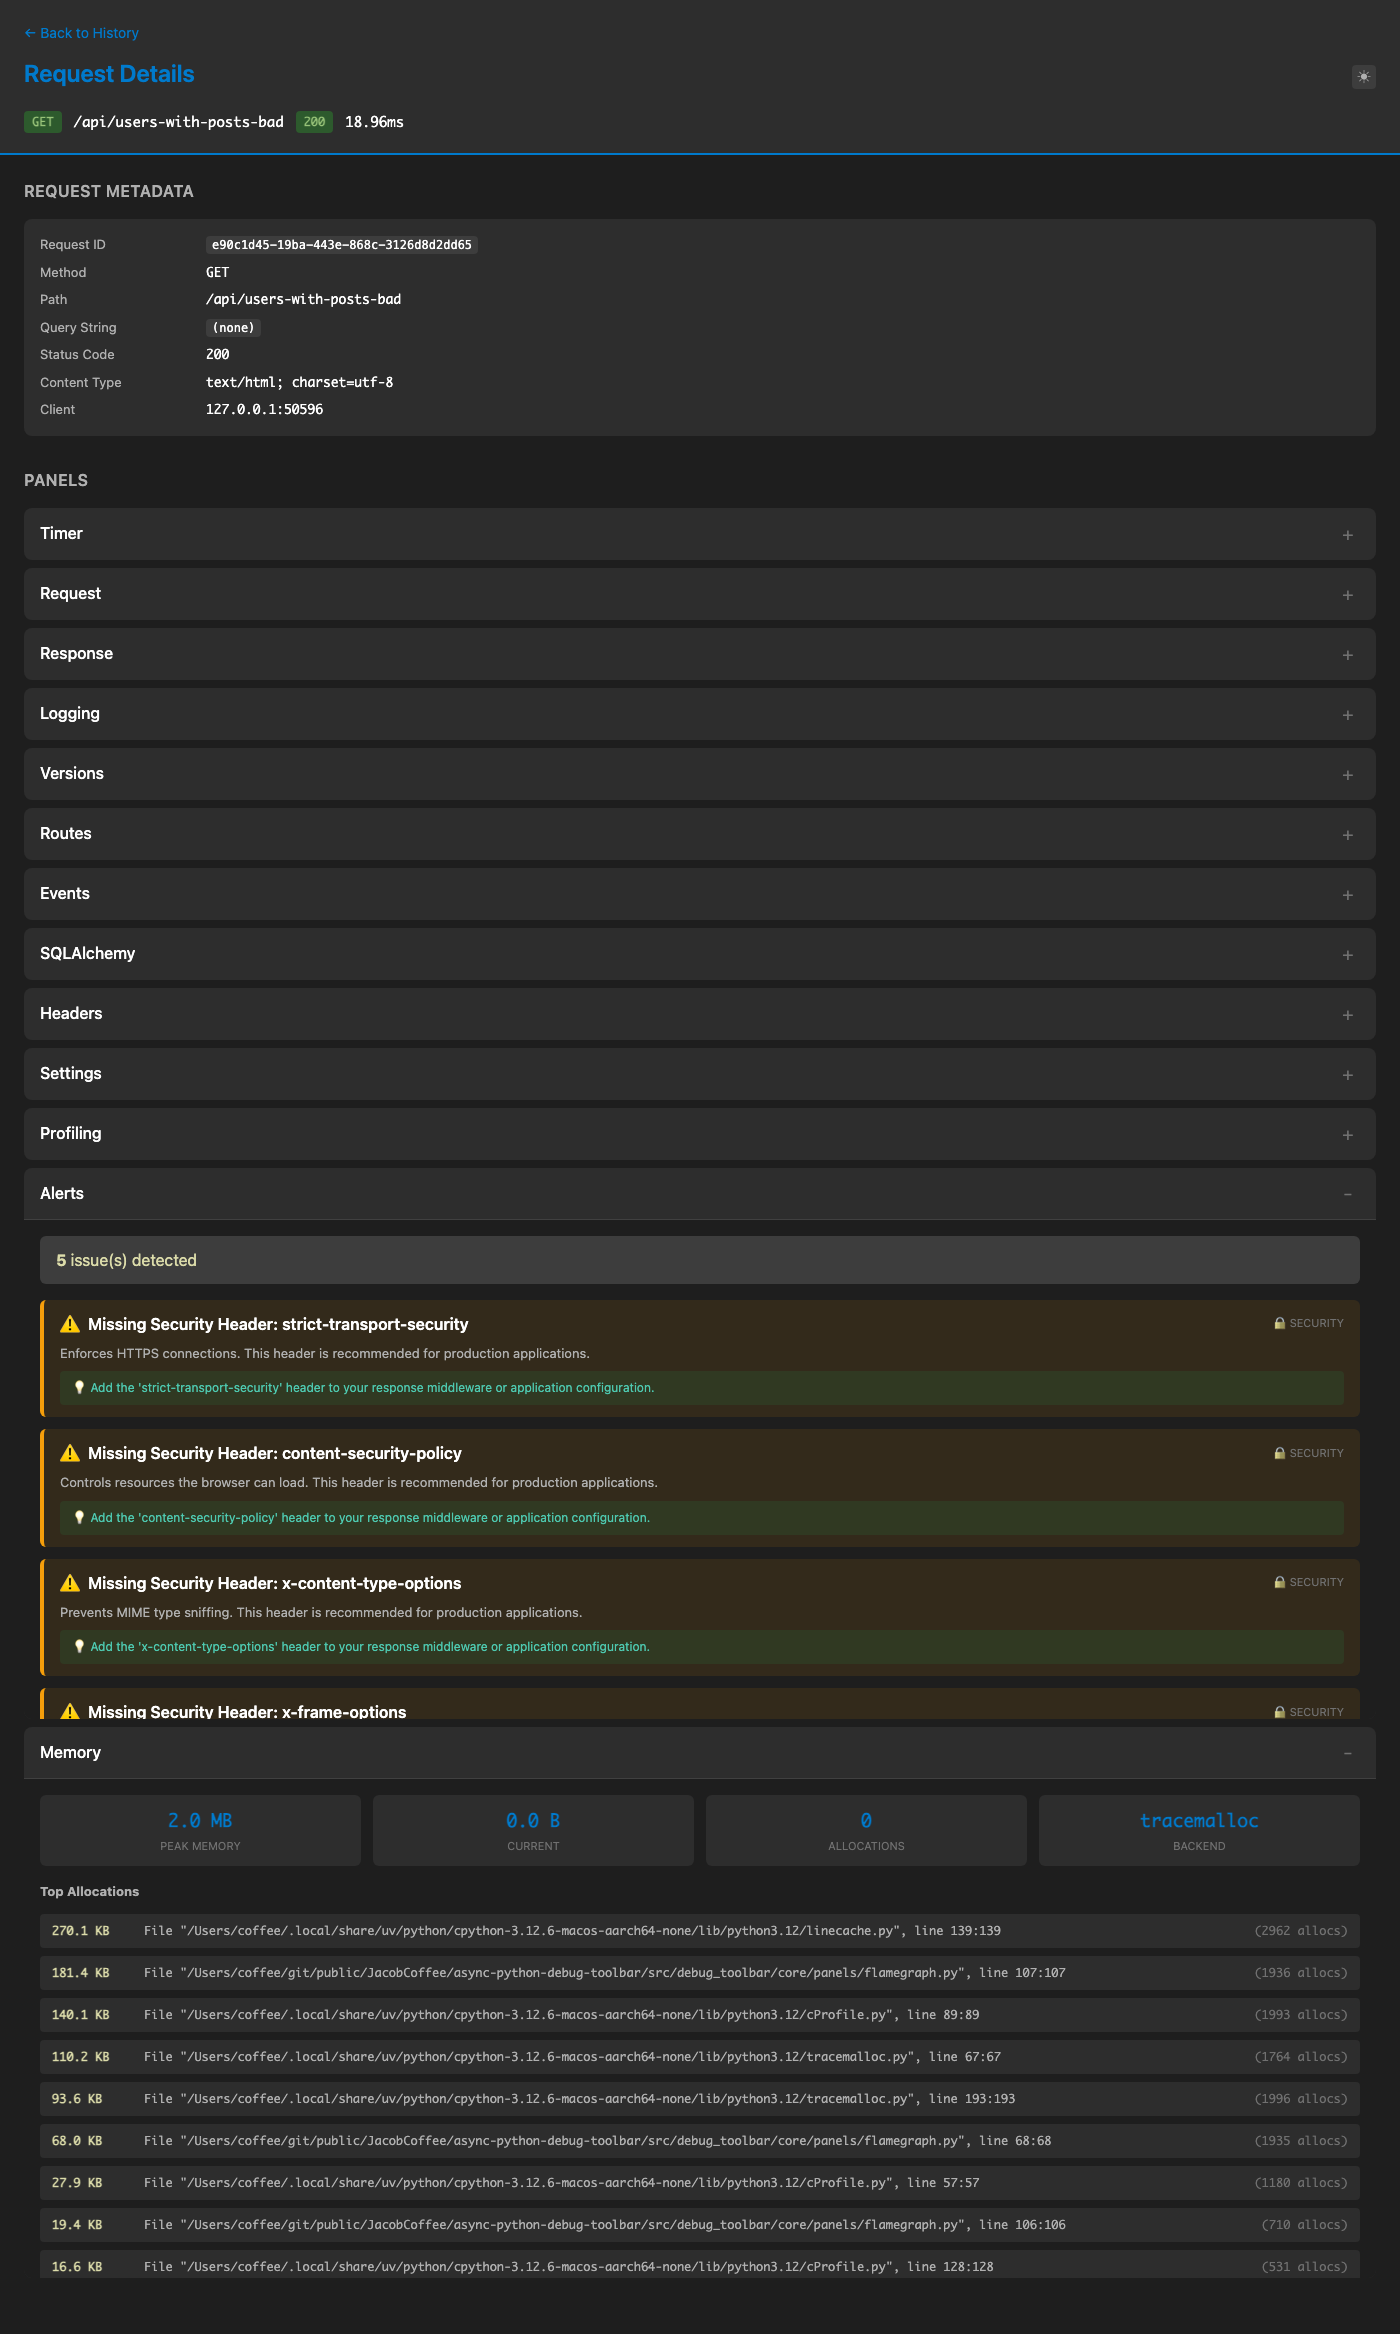
Memory profiling and allocation tracking:
Backends:
tracemalloc: Python’s built-in memory tracer (default)memray: Advanced memory profiler (requirespip install memray)auto: Automatically selects the best available backend
Features:
Memory allocation tracking per request
Top allocations by size
Memory snapshots comparison
Peak memory usage
Allocation source locations (file:line)
Enable in config:
config = LitestarDebugToolbarConfig(
    extra_panels=["debug_toolbar.core.panels.memory.MemoryPanel"],
    memory_backend="auto",  # "tracemalloc", "memray", or "auto"
)
Cache Panel
ID: CachePanel
Redis and memcached operation tracking:
Cache hits and misses
Operation types (GET, SET, DELETE, etc.)
Operation timing
Key information
Backend breakdown
Enable in config:
config = LitestarDebugToolbarConfig(
    extra_panels=["debug_toolbar.core.panels.cache.CachePanel"],
)
Litestar-Specific Panels
Routes Panel
ID: RoutesPanel
Litestar-specific panel showing:
All registered routes
HTTP methods
Handler names
Current matched route
Automatically added for Litestar applications.
Events Panel
ID: EventsPanel
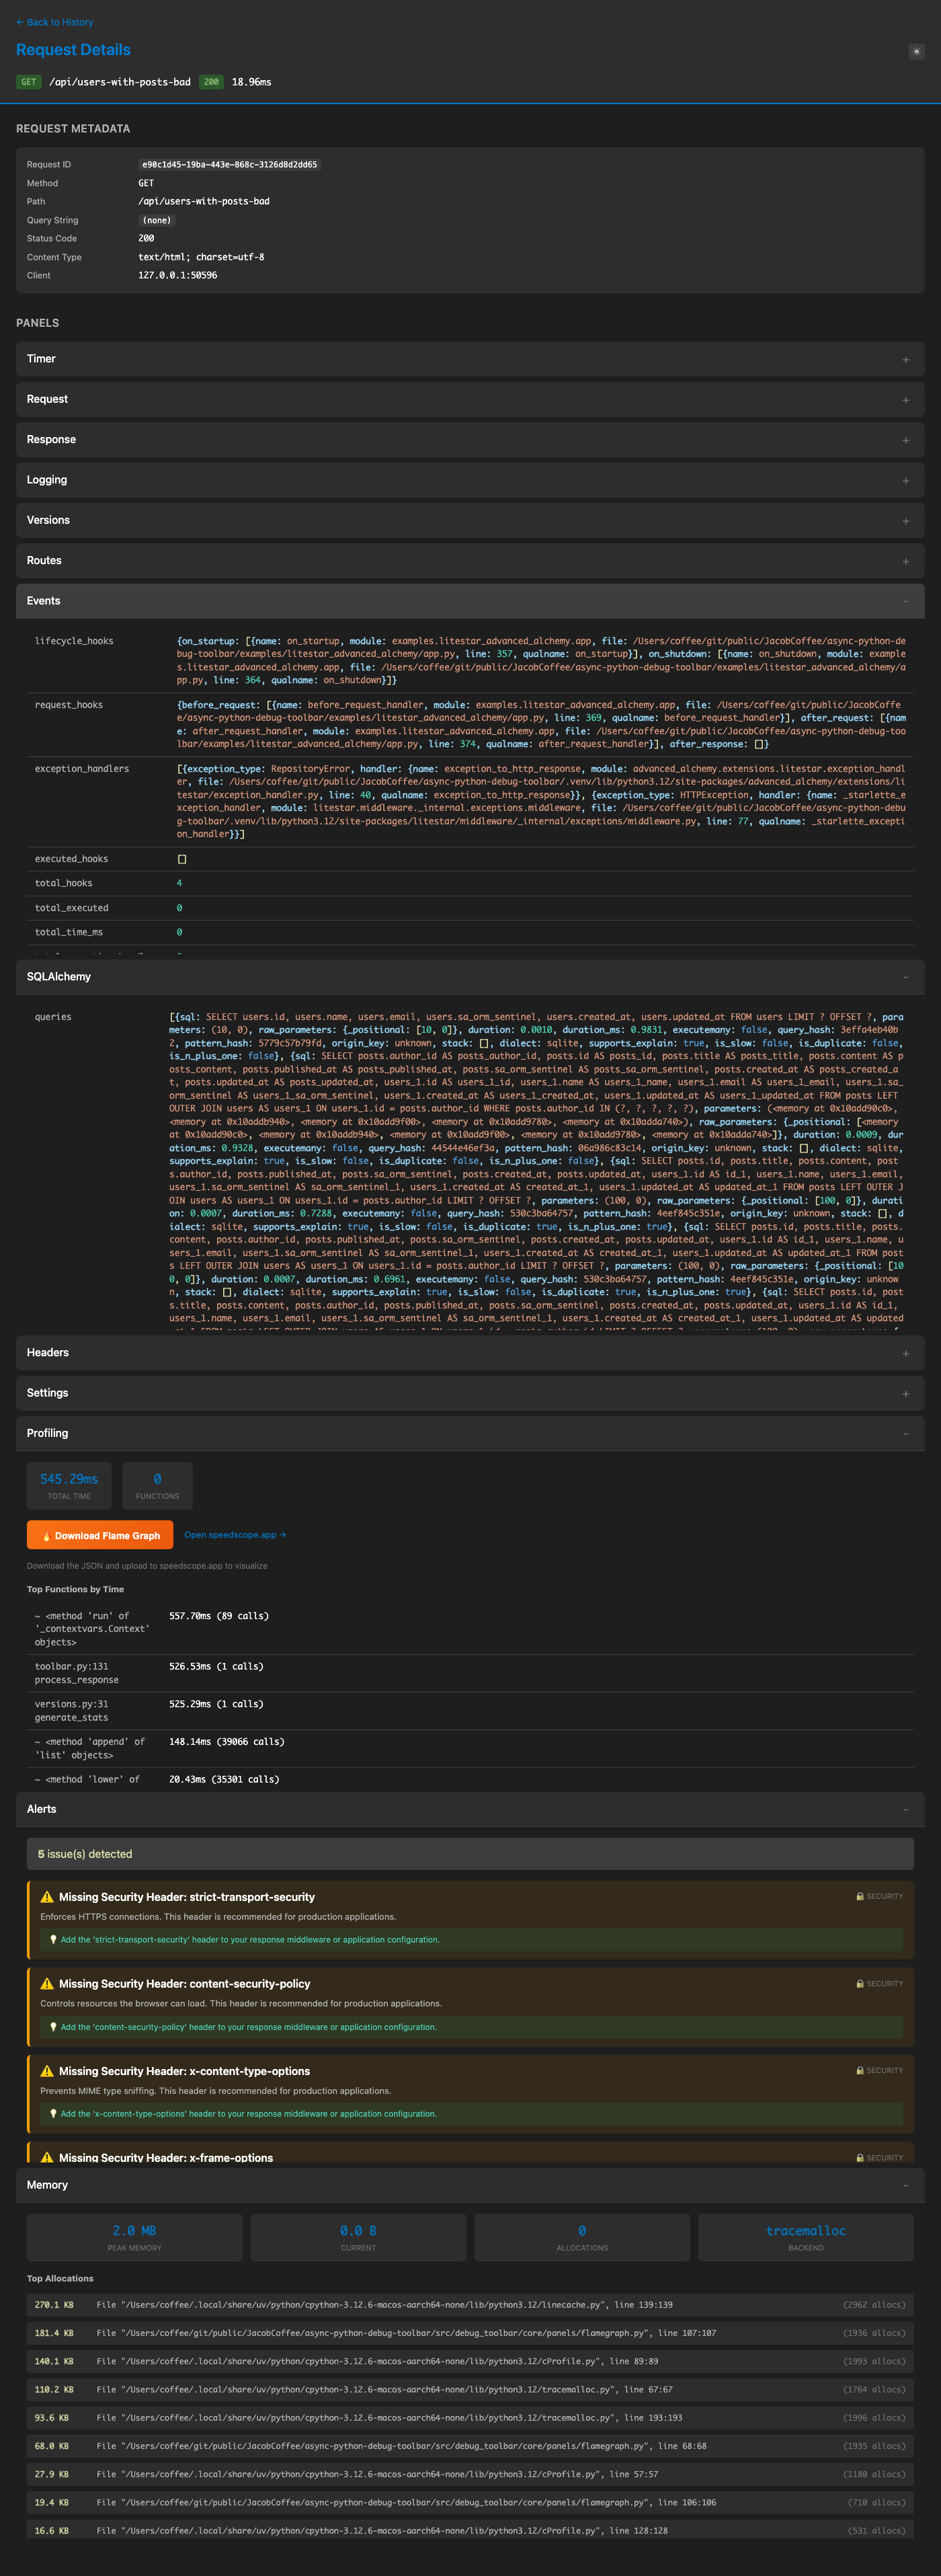
Litestar-specific panel showing lifecycle events and handlers:
Lifecycle hooks:
on_startup,on_shutdownhandlersRequest hooks:
before_request,after_request,after_responsehandlersException handlers: Registered exception handlers with their exception types
Handler function details (name, module, file location, line number)
Total hook count and execution statistics
This panel helps you understand:
What lifecycle hooks are registered in your application
Which exception handlers are configured
The source location of each handler for easy debugging
Automatically added for Litestar applications.
WebSocket Panel
ID: WebSocketPanel
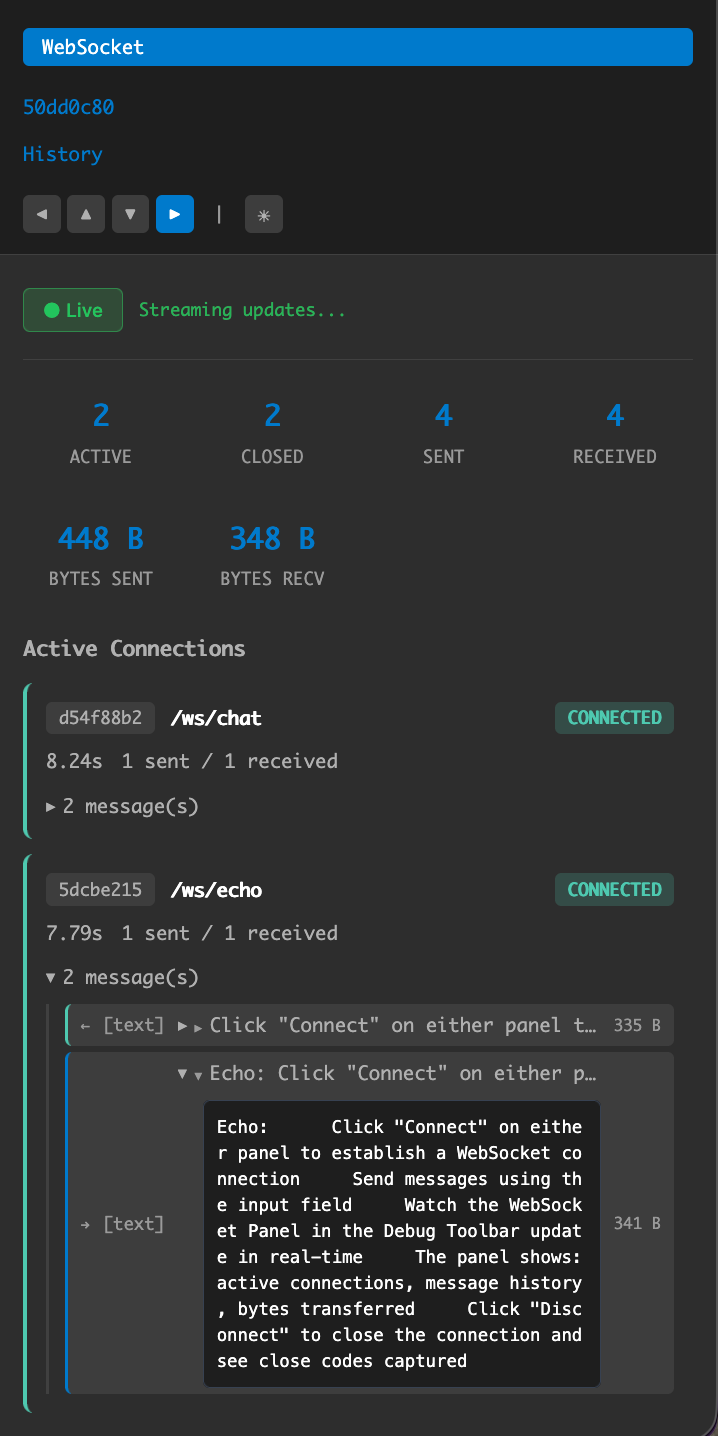
Real-time WebSocket connection tracking and message inspection:
Connection Tracking:
Active and closed connections with lifecycle states
Connection path, query string, and headers
Connection duration and close codes/reasons
Bytes sent/received per connection
Message Inspection:
Bidirectional message logging (sent/received)
Message content preview with expandable full content
Message size and timestamp
Support for text and binary messages
Live Updates:
Real-time updates via
/_debug_toolbar/ws/liveWebSocket endpointClick “Go Live” to stream connection and message events
Statistics update in real-time as WebSocket activity occurs
Configuration:
config = LitestarDebugToolbarConfig(
    websocket_tracking_enabled=True,           # Enable WebSocket tracking
    websocket_max_connections=50,              # Max connections to track
    websocket_max_messages_per_connection=100, # Max messages per connection
    websocket_max_message_size=10240,          # Max message size (bytes)
    websocket_connection_ttl=3600,             # TTL for closed connections
)
Automatically added when WebSocket handlers are detected in your application.
Extra Panels
SQLAlchemy Panel
ID: SQLAlchemyPanel
Requires debug-toolbar[advanced-alchemy]:
Query Tracking:
Query count and total time
Individual query details with SQL and parameters
Duplicate query detection
Slow query highlighting (configurable threshold)
N+1 Query Detection:
Automatic detection of N+1 query patterns
Groups similar queries by normalized SQL pattern and origin
Shows call stack for each N+1 group
Provides fix suggestions (eager loading, batching)
Badges on affected queries (N+1, SLOW, DUP)
EXPLAIN Support:
Execute EXPLAIN on any query
Supports PostgreSQL, SQLite, MySQL, MariaDB
View query execution plans
Enable in config:
config = LitestarDebugToolbarConfig(
    extra_panels=["debug_toolbar.extras.advanced_alchemy.SQLAlchemyPanel"],
)
Recommended Configuration
For comprehensive debugging, enable all panels:
from debug_toolbar.litestar import DebugToolbarPlugin, LitestarDebugToolbarConfig

config = LitestarDebugToolbarConfig(
    enabled=True,
    extra_panels=[
        "debug_toolbar.extras.advanced_alchemy.SQLAlchemyPanel",  # If using SQLAlchemy
        "debug_toolbar.core.panels.headers.HeadersPanel",
        "debug_toolbar.core.panels.settings.SettingsPanel",
        "debug_toolbar.core.panels.templates.TemplatesPanel",
        "debug_toolbar.core.panels.profiling.ProfilingPanel",
        "debug_toolbar.core.panels.alerts.AlertsPanel",
        "debug_toolbar.core.panels.memory.MemoryPanel",
        "debug_toolbar.core.panels.cache.CachePanel",
    ],
)

app = Litestar(
    route_handlers=[...],
    plugins=[DebugToolbarPlugin(config)],
)